EQT Q1 2026 Brief: Appalachian Gas, Curtailments, and PA/WV State-Source Signals
EQT Q1 2026 earnings showed higher Appalachian gas volumes, record free cash flow, Q2 curtailments, and PA/WV state-source signals.
By Johnathan · Reviewed by EnergyNetWatch Research · Last updated 2026-05-09
Key Takeaways
- EQT reported 618 Bcfe of Q1 2026 sales volume, up 8% year over year, and $1.832 billion of free cash flow attributable to EQT.
- Q2 guidance includes 570-620 Bcfe of sales volume and 10-15 Bcfe of strategic curtailments.
- Energy-NetWatch confirms PA production records through February 2026 and WV H6A monthly production fields through December 2025 in the 2025 Q4 workbook.
EQT's first-quarter 2026 update was a strong Appalachian gas quarter: higher sales volumes, stronger realized pricing, record free cash flow, and a clear signal that Q2 volumes will be managed around shoulder-season gas prices.
For Energy-NetWatch, the useful follow-up is not a broad company-production comparison. The better read is source-level: where Pennsylvania and West Virginia public records show EQT-linked gas, which counties matter, how recent the state-source records are, and what permit activity says about near-term Appalachian workflows.
EQT reported 618 Bcfe of Q1 2026 sales volume, up from 571 Bcfe a year earlier. Average realized price improved to $5.08/Mcfe, and free cash flow attributable to EQT reached $1.832 billion. The company also guided Q2 2026 sales volume to 570-620 Bcfe, including 10-15 Bcfe of planned strategic curtailments.
| EQT reported | Q1 2026 | Prior comparison | Change |
|---|---|---|---|
| Total sales volume | 618 Bcfe | 571 Bcfe | +8% |
| Average realized price | $5.08/Mcfe | $3.77/Mcfe | +35% |
| Net cash from operating activities | $3.055B | $1.741B | +75% |
| Free cash flow | $1.945B | $1.151B | +69% |
| Free cash flow attributable to EQT | $1.832B | $1.036B | +77% |
| Total debt at quarter-end | $6.0B | $7.8B at 2025 year-end | -23% |

EQT Q1 2026 Earnings and Production Read
The quarter was not just a higher-price story. EQT said sales volumes came in above guidance because of strong well performance, system pressure optimization, and execution during Winter Storm Fern. Capital expenditures were $608 million, below guidance, and total per-unit operating costs were $1.09/Mcfe.
That combination matters for an Appalachian gas operator. Higher realized pricing helps any gas producer, but the cleaner read is that EQT grew volumes, protected margins, reduced debt, and still kept a clear curtailment lever for Q2. The balance-sheet signal also improved during the quarter: EQT said Fitch upgraded the company to BBB after the debt reduction.
The Q2 guide is important. EQT expects 570-620 Bcfe of sales volume in Q2, including 10-15 Bcfe of strategic curtailments. Management described those curtailments as a way to keep gas in the ground during weaker seasonal demand and bring volumes back when demand improves. For an operator with a large Appalachian inventory, that is a portfolio-management signal, not just a production headline.
PA and WV State-Source Signals
The Energy-NetWatch snapshot for this brief uses matched EQT state-source aliases including EQT ARO LLC, EQT CHAP LLC, EQT PROD CO, and EQT PRODUCTION COMPANY.
Those records show a gas-weighted Appalachian view across Pennsylvania and West Virginia. The two states are both important, but they do not publish on the same clock. Energy-NetWatch currently has Pennsylvania EQT-linked production loaded through February 2026. The May 2026 Pennsylvania pull contains February production rows, which is consistent with the state publication calendar. West Virginia EQT-linked production is loaded through the 2025 Q4 H6A workbook, with monthly gas and oil fields through December 2025.

| State | Latest production month | Latest matched gas | Wells with production | 2026 matched permits | Latest matched permit |
|---|---|---|---|---|---|
| Pennsylvania | Feb. 2026 | 116.8 Bcf | 2,000 | 27 | Mar. 19, 2026 |
| West Virginia | Dec. 2025 | 58.5 Bcf | 1,138 | 24 | Mar. 25, 2026 |
West Virginia's latest H6A workbook also shows 735.7 Bcf of matched full-year 2025 gas and 2.0 million bbl of matched full-year 2025 oil. Pennsylvania's latest matched production month is gas-weighted, with no matched oil volume in the February 2026 file. Permit freshness is more current than production freshness in both states: after the May 9 permit refresh, EQT-linked Pennsylvania permits are current through March 19, 2026, and EQT-linked West Virginia permits are current through March 25, 2026 in the matched snapshot.
Operator identity note: this snapshot matches EQT-linked state-source names including EQT ARO LLC, EQT CHAP LLC, EQT PROD CO, and EQT PRODUCTION COMPANY.
The screenshot below shows the authenticated app workflow for EQT PRODUCTION COMPANY in West Virginia. It is included as a workflow example: the app keeps the operator tied to source month, production trend, active and producing wells, county concentration, permit activity, and Workbench handoff.
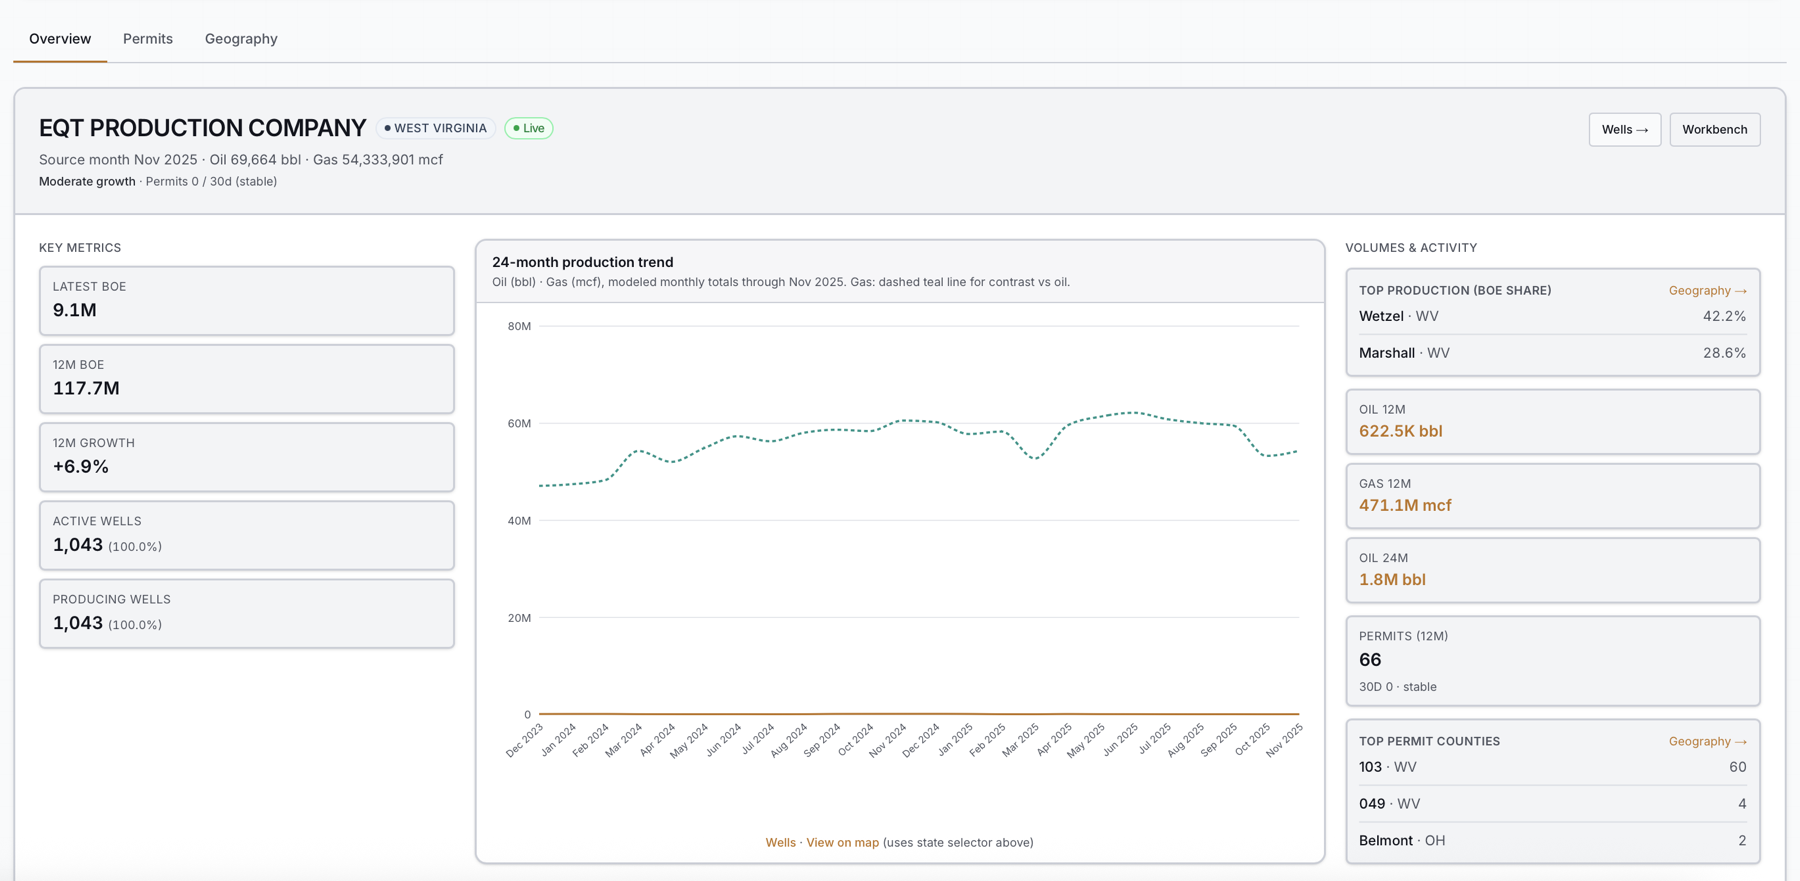
Energy-NetWatch app view for EQT-linked West Virginia records. Public articles use rounded static snapshots; the authenticated app is built for current operator follow-up, maps, exports, alerts, and saved work.
The county read-through is also useful. In the latest Pennsylvania production file, the largest matched gas counties are Greene, Washington, Lycoming, Westmoreland, Allegheny, and Fayette. In the West Virginia Q4 H6A workbook, the largest matched gas counties are Wetzel, Marshall, Marion, Doddridge, Ritchie, and Tyler. The 2026 permit signal points to continued EQT-linked activity in Greene and Washington counties in Pennsylvania and Wetzel County in West Virginia. That gives a practical map for following EQT-linked activity after earnings: southwest Pennsylvania for current monthly source movement, northern West Virginia for the larger H6A workbook signal, and March 2026 permit records for near-term activity follow-up.
Source Timing and Follow-Through
EQT's quarterly report shows the company-level result. State-source records help track where that activity is visible at the well, county, operator-alias, and permit level after the quarter closes.
EQT's Q1 2026 reported sales volume tells investors what the company delivered during the quarter. Pennsylvania and West Virginia public records add the operating layer: which source records are visible, how current each state source is, and which aliases, counties, wells, and permits support follow-up work. Pennsylvania is currently the more frequent production source. West Virginia publishes H6A production in quarterly workbooks, with monthly fields inside the workbook. Permit records move on a separate source clock, and the current Energy-NetWatch permit snapshot carries EQT-linked PA and WV activity into March 2026.
That is especially important for EQT because recent company materials also reference acquired upstream and midstream assets from Olympus Energy, Hyperion Midstream, and Bow & Arrow Land. Acquisition history can leave public records under legacy or state-specific names before every record collapses cleanly into a parent-company view. Energy-NetWatch treats that as an operator identity problem: the app keeps the parent-company story connected to state-source names, aliases, and source freshness.
Analyst Takeaway
EQT's Q1 update was a cash-flow and control story. Sales volume increased 8% year over year, realized pricing improved, free cash flow attributable to EQT rose to $1.832 billion, and net debt fell sharply from year-end 2025. The company also made the Q2 setup clear: volumes are expected to step down from Q1 levels, partly because EQT plans to curtail 10-15 Bcfe into a softer seasonal gas window.
The Energy-NetWatch read-through is concentrated in Appalachian source records. Pennsylvania and West Virginia show the relevant public-record base, but the two states have different production calendars and separate permit-refresh paths. That makes EQT a good example of why operator intelligence needs more than a ticker, a quarterly release, and one production number.
For teams watching Appalachian gas, the follow-up workflow is straightforward: monitor Pennsylvania monthly files and West Virginia H6A workbook updates, track EQT-linked permit activity through the current March 2026 permit signal, watch core counties such as Greene, Washington, Wetzel, Marshall, Lycoming, and Marion, and keep operator aliases current as acquisitions and state-source names change.
For current records, well histories, maps, exports, alerts, and API access, the public brief is the starting point. Request Energy-NetWatch access to review current Appalachian operator and state-source data.
Frequently Asked Questions
What were EQT's Q1 2026 earnings highlights?
EQT reported 618 Bcfe of Q1 2026 sales volume, up from 571 Bcfe a year earlier. The company also reported $3.055 billion of net cash from operating activities and $1.832 billion of free cash flow attributable to EQT.
Why did EQT guide to lower Q2 2026 volumes?
EQT guided Q2 2026 sales volume to 570-620 Bcfe, including 10-15 Bcfe of strategic curtailments. Management framed the curtailments as a way to hold gas back during weaker shoulder-season demand and bring volumes forward when demand improves.
Where does Energy-NetWatch show EQT-linked public records?
This Energy-NetWatch snapshot shows EQT-linked public-record context in Pennsylvania and West Virginia, using matched state-source aliases including EQT ARO LLC, EQT CHAP LLC, EQT PROD CO, and EQT PRODUCTION COMPANY.
Why are Pennsylvania and West Virginia production months different?
State-source production records publish on regulator-specific schedules. In this Energy-NetWatch snapshot, Pennsylvania matched production records are loaded through February 2026. West Virginia's latest H6A production source is the 2025 Q4 workbook, with monthly fields through December 2025. Permit records publish on a different clock: the matched EQT permit snapshot is current through March 19, 2026 in Pennsylvania and March 25, 2026 in West Virginia. That source timing is part of the analytical read: users can see which state clock they are reading, which records are current for that source, and where the next update should change the view.
Is the Energy-NetWatch snapshot the same as EQT's reported production?
No. EQT's reported production is a company-reported quarterly metric. Energy-NetWatch state-source snapshots are normalized public records from covered state sources. They are used for operator identity, state, county, permit, well-level, production-month, and source-freshness follow-up.
Sources
- EQT first-quarter 2026 results
- EQT Q1 2026 earnings call transcript
- Energy-NetWatch static state-source snapshot, refreshed May 8, 2026, with PA/WV production and permit freshness reviewed May 9, 2026
Data notes
Energy-NetWatch EQT figures are rounded public state-source snapshots reviewed on May 9, 2026. They are used for Pennsylvania and West Virginia production-month, permit, operator, and source-freshness review.
Recommended next reads
How to Track Drilling Permits by Operator Before Production Shows Up (2026)
Learn how to track drilling permits by operator, connect permits to later production signals, and avoid common state-source mistakes.
Why Oil and Gas Data Is Hard to Normalize Across States (2026)
See why oil and gas data normalization is difficult across states, source schemas, identifiers, reporting cadence, permits, and production.
Public vs Paid Oil and Gas Data: When State Portals Are Enough (2026)
Compare public vs paid oil and gas data, including state portals, normalized workflows, app access, exports, maps, and public samples.
How to Access Free Oil & Gas Production Data Across 26 States (2026 Guide)
Learn where free oil and gas production data comes from, why state records are fragmented, and how EnergyNetWatch tracks 26 states.
Related EnergyNetWatch pages
Want the current table behind this analysis?
Public articles use selected examples. Request access if your team needs current source refreshes, exact identifiers, maps, exports, alerts, saved workflows, or API access for this market.