New Mexico Oil and Gas Production Data: OCD Sources and Public Samples (2026)
New Mexico OCD oil and gas data guide for production, permits, reported spuds, county context, and EnergyNetWatch source-date workflows.
By Johnathan · Reviewed by EnergyNetWatch Research · Last updated 2026-06-17
Key Takeaways
- New Mexico data is not a Texas clone; OCD source structure, cadence, and field behavior require separate handling.
- The public New Mexico sample shows real rounded EnergyNetWatch production records through February 2026 with Lea, Eddy, San Juan, and Rio Arriba context.
- A separate February 16-May 15, 2026 operator activity snapshot showed 694 permit records, 87 reported spuds, and 38 operator labels with permit activity.
New Mexico oil and gas production data matters because New Mexico is one of the most important states for modern Permian analysis. Lea and Eddy counties sit inside the Delaware Basin, while San Juan and Rio Arriba provide a different gas-weighted and legacy-basin context.
The New Mexico Oil Conservation Division (OCD), part of the Energy, Minerals and Natural Resources Department, is the primary state source family for New Mexico oil and gas records. Like every state, New Mexico has its own source structure, cadence, terminology, and access patterns. That means New Mexico data cannot be treated as a Texas clone, even when analysts are comparing Delaware Basin activity across the state line.
EnergyNetWatch includes a public New Mexico data sample because it is a strong comparison point: important enough to matter commercially, but different enough from Texas to show why source-aware normalization is necessary.
What New Mexico OCD Data Provides
New Mexico OCD data supports workflows around wells, production, permits, operators, and regulatory context. The details vary by source and reporting workflow, but the important point is that New Mexico has meaningful public records that can be used for oil and gas analysis.
Common New Mexico workflows include:
| Workflow | Why it matters |
|---|---|
| County production review | Compare Lea, Eddy, San Juan, and other counties |
| Operator activity tracking | Understand who is active in the Delaware Basin and other areas |
| Well lookup | Connect well identifiers, source records, and production context |
| Production trends | Track oil and gas changes over time |
| Cross-state comparison | Compare New Mexico Permian activity with Texas Permian activity |
The public data exists, but using it well requires source context. A production row, a permit record, and a well record may not carry the same fields or update on the same cadence. That is where a normalized data platform becomes valuable.
How New Mexico Oil and Gas Data Differs From Texas
New Mexico and Texas both matter for Permian analysis, but their source systems are not the same.
Texas has specific lease-level production issues that matter for well-level interpretation. New Mexico has its own OCD data structure and cadence. A workflow that looks simple in one state can need different joins, labels, or caveats in the other.
That matters for:
- operator comparisons
- county trend analysis
- well-level production review
- decline curve analysis and EUR workflows
- permit-to-production monitoring
- basin-level reporting
If the goal is to compare Delaware Basin wells or operators across the state line, the source differences have to be visible rather than hidden.
Key New Mexico Counties To Understand
The EnergyNetWatch public sample emphasizes four county contexts.
Lea County
Lea County is one of the most important New Mexico oil and gas counties for Permian activity. It is a natural public sample county because operator activity, production context, and Delaware Basin workflows all matter there.
Eddy County
Eddy County is another core New Mexico Permian county. For many users, Lea and Eddy are the starting point for New Mexico operator, production, and permit analysis.
San Juan County
San Juan County gives the public sample a more gas-weighted and legacy-basin view. That helps show that New Mexico analysis is not only about oil-weighted Delaware Basin activity.
Rio Arriba County
Rio Arriba adds additional legacy basin context. It helps demonstrate why county context matters when interpreting statewide totals.
How EnergyNetWatch Presents New Mexico Oil and Gas Production Data
The New Mexico data sample is based on real EnergyNetWatch New Mexico records, then rounded, masked, and intentionally lagged for public display.
The page includes:
- rounded monthly oil and gas totals
- a six-month public sample range
- county rows for Lea, Eddy, San Juan, and Rio Arriba
- selected operator rows
- masked sample well records
- a source method table
- public lag and latest included month
The sample is not meant to replace app access. It is meant to show data quality, field structure, state coverage, and the kind of workflow context EnergyNetWatch can provide.
New Mexico Source Stack: Production, Permits, And Reported Spuds
The stronger New Mexico workflow is not just a production table. Buyers usually need the source stack: production for reported scale, permits for current drilling intent, reported spuds for field-activity evidence, and county context for routing the work.
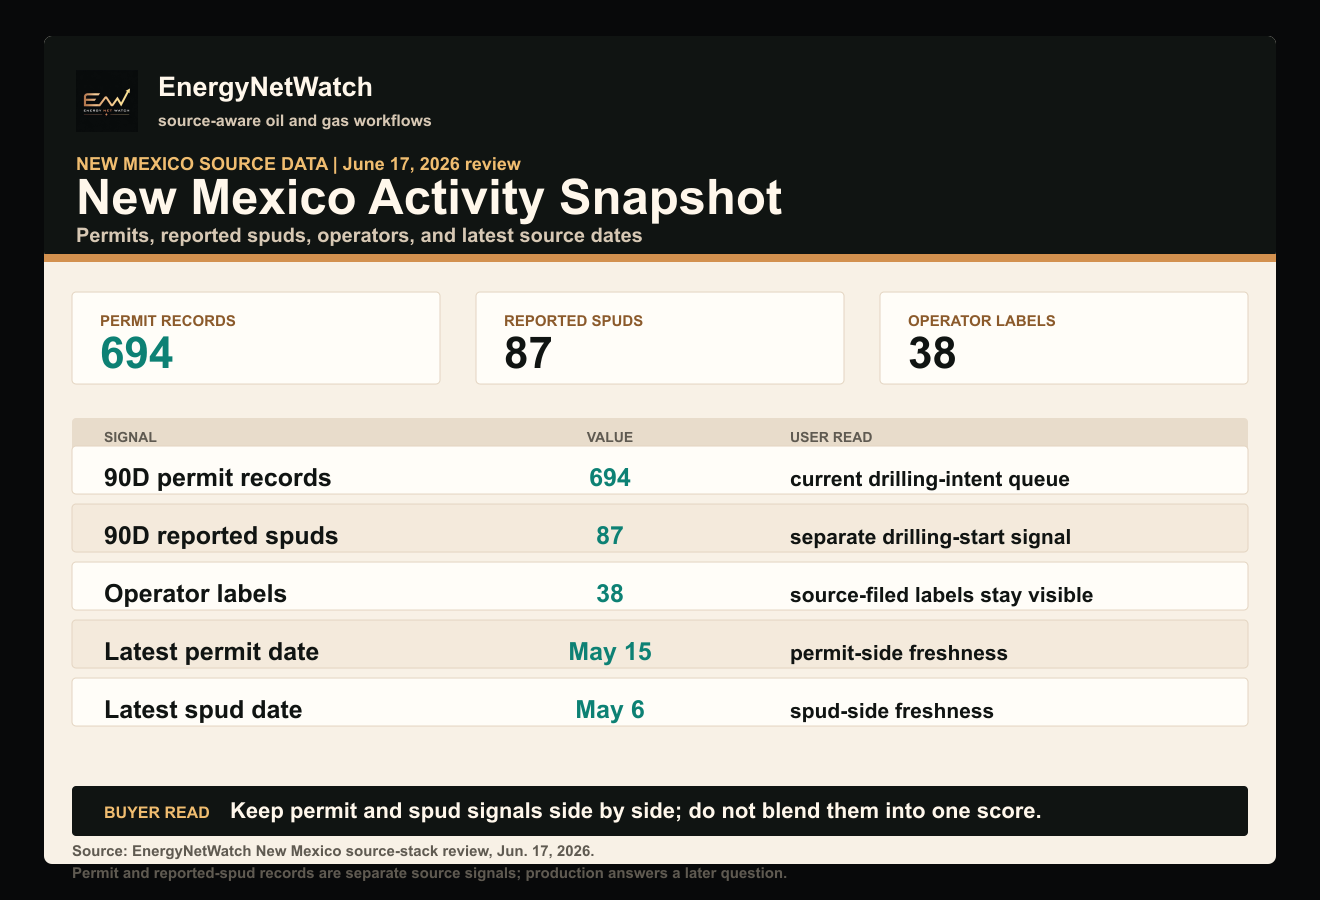
EnergyNetWatch New Mexico state-source review for February 16-May 15, 2026. Permit records and reported spud records are separate public-record signals and should not be read as production volumes.
The published New Mexico permit/spud snapshot reviewed the trailing 90-day window from February 16 through May 15, 2026. It showed 694 permit records, 87 independent reported spud records, and 38 operator labels with permit activity. The latest permit record in that review was May 15, 2026. The latest reported spud record was May 6, 2026.
That activity snapshot answers a different question from the production sample below. Production shows reported volume history. Permits and reported spuds show earlier operating signals. A useful New Mexico data workflow keeps those signals separated before ranking operators, counties, or accounts.
Current New Mexico public sample values:
| Field | Public sample value |
|---|---|
| Public snapshot | May 2026 |
| Latest included production month | 2026-02 |
| Public lag | 3 months |
| Indexed well rows | 195K+ |
| Basin focus | Delaware Basin, San Juan Basin |
| Public sample scope | State dashboard |
Rounded New Mexico production trend shown publicly:
| Month | Oil | Gas |
|---|---|---|
| 2025-09 | 58M bbl | 265B mcf |
| 2025-10 | 59M bbl | 268B mcf |
| 2025-11 | 60M bbl | 270B mcf |
| 2025-12 | 61M bbl | 274B mcf |
| 2026-01 | 62M bbl | 276B mcf |
| 2026-02 | 63M bbl | 279B mcf |
Representative county context:
| County | Public sample role | Why it is included |
|---|---|---|
| Lea | High Permian activity | Core Delaware Basin production and operator workflows |
| Eddy | High Permian activity | Production and permit context |
| San Juan | Gas-weighted context | Legacy basin and gas comparison |
| Rio Arriba | Legacy basin context | Shows basin differences inside the same state |
How To Interpret the Public New Mexico Trend
The public New Mexico trend is intentionally simple. It is not a live operating dashboard and it is not meant to answer every question about a specific well, operator, or lease position.
It is useful for three things.
First, it shows that EnergyNetWatch can present New Mexico production as a clean monthly sequence instead of a source-specific file dump. Second, it shows the public freshness boundary: the page is a May 2026 public snapshot with production shown through February 2026. Third, it gives readers a way to compare New Mexico against the Texas and North Dakota samples without assuming each state has identical source behavior.
For current work, the next question is usually more specific: which operator, county, API, basin, or offset set do you need to monitor? That is where app access becomes different from the public page.
Public Lag, Masking, and Rounding
Public sample pages intentionally do not publish raw app rows. They use:
- rounded state totals
- masked API numbers
- selected representative wells
- selected county/operator summaries
- a deliberate public lag
That makes the public page useful for evaluation without turning the marketing site into a bulk data export.
What App Access Adds for New Mexico Data
For New Mexico, app access is where users get the workflows that matter for actual work:
- current source refreshes where available
- complete well histories
- unmasked records
- maps and coordinates
- exports
- operator benchmarking
- saved filters
- decline curve analysis and economics workflows
The public sample answers: "Does EnergyNetWatch understand this state and source context?" App access answers: "Can I use this data for my current workflow?"
Frequently Asked Questions
Is New Mexico oil and gas production data public?
Yes. New Mexico oil and gas records are available through state source systems, including OCD-related resources. The challenge is turning source data into a normalized, searchable workflow.
Why does EnergyNetWatch include New Mexico as a public sample?
New Mexico is a high-value state for Permian analysis. It gives users a strong comparison point against Texas and shows Delaware Basin, San Juan Basin, county, and operator context.
Are the public New Mexico numbers real?
Yes. The public sample is based on real EnergyNetWatch records. Public values are rounded, masked, selected, and intentionally lagged.
What should I use for current New Mexico records?
Use app access if you need current source refreshes, unmasked well records, complete production histories, maps, exports, and workflow tools.
Sources
Data notes
Public New Mexico examples use real EnergyNetWatch records that are rounded, masked, selected, and intentionally lagged for display. Full current records and workflow outputs are available with app access.
Recommended next reads
New Mexico Drilling Activity Snapshot: Permits and Reported Spuds by Operator
New Mexico operators ranked by trailing 90-day permit records and independent reported spud records from EnergyNetWatch app data.
Texas Oil and Gas Production Reporting: RRC Data and Public Samples (2026)
Texas oil and gas production reporting guide covering RRC production lag, public samples, operator labels, and EnergyNetWatch workflows.
Oil And Gas Data Freshness: Why Permits, Spuds, And Production Dates Differ (2026)
Oil and gas data freshness guide explaining why permits, reported spuds, and production records have different source dates.
Oil and Gas Data API: Operators, Permits, Wells, Production, and Source Dates (2026)
Oil and gas data API guide for operators, permits, wells, production, infrastructure records, and source-aware integrations.
Related EnergyNetWatch pages
Want the current table behind this analysis?
Public articles use selected examples. Request access if your team needs current source refreshes, exact identifiers, maps, exports, alerts, saved workflows, or API access for this market.