North Dakota Operator Production: March 2026 Oil And Gas Snapshot
Energy-NetWatch reviewed modeled North Dakota well production for March 2026, ranking top Bakken operators by oil and gas volumes while excluding partial April rows.
By Johnathan · Reviewed by EnergyNetWatch Research · Last updated 2026-05-21
Key Takeaways
- March 2026 is the latest full modeled North Dakota production month in this Energy-NetWatch pull.
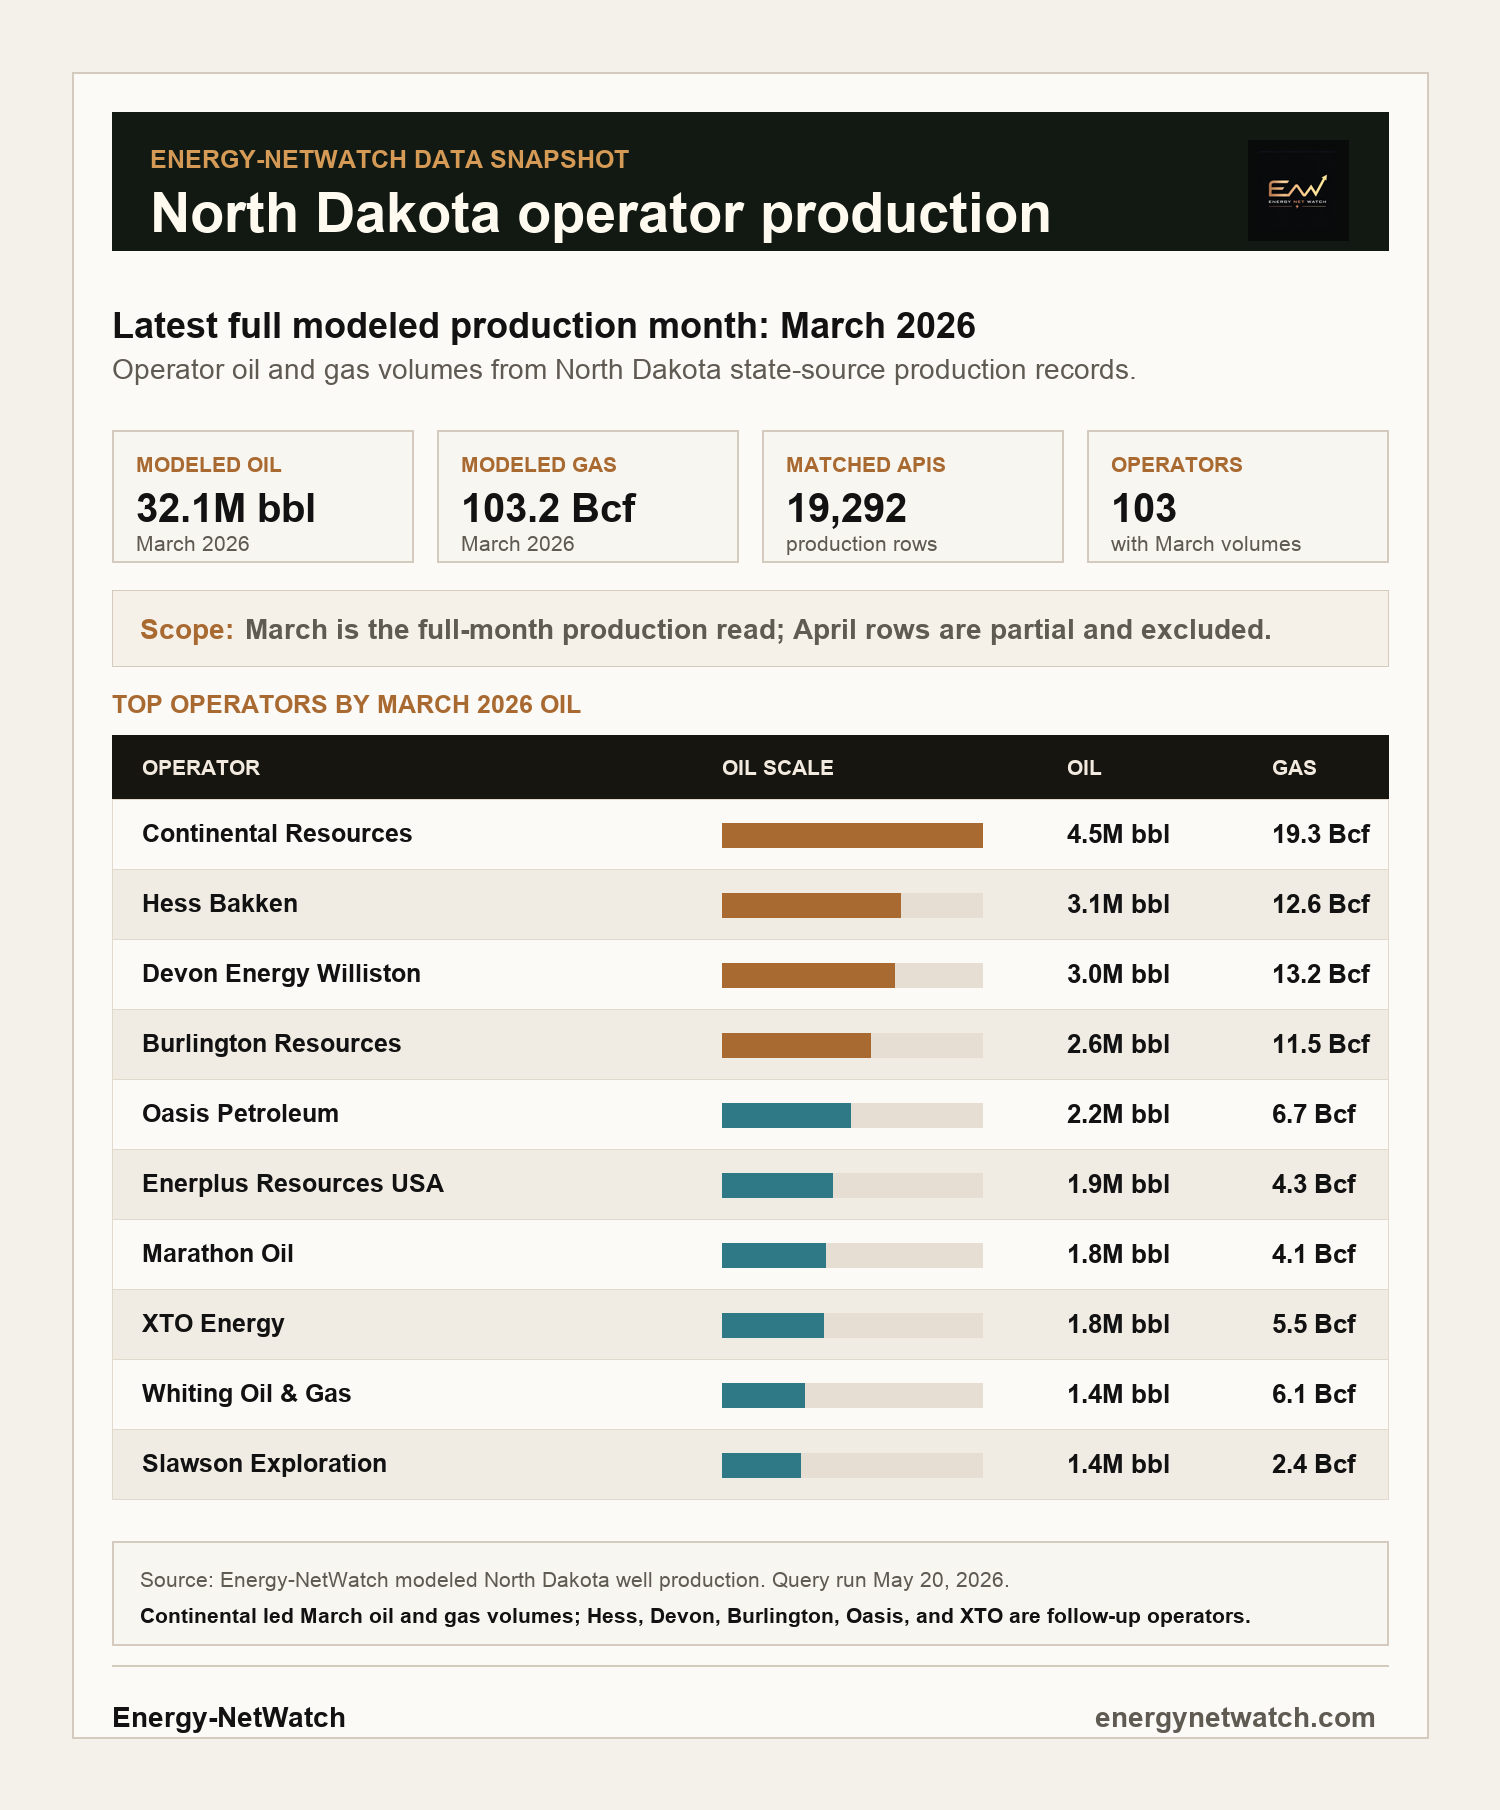
- Continental Resources led the March operator table with 4.5M bbl of modeled oil and 19.3 Bcf of modeled gas.
- April rows were visible but partial, so they were excluded from the operator ranking.
North Dakota operator production is a useful follow-up screen for Bakken activity because it connects operator names to state-source oil and gas volumes after wells move beyond the permit and drilling-start stage.
Energy-NetWatch reviewed modeled North Dakota well production for March 2026, the latest full modeled production month in this pull. April 2026 rows exist, but they are partial and excluded from the operator ranking.
The March snapshot shows 32.1 million barrels of modeled oil, 103.2 Bcf of modeled gas, 19,292 matched production APIs, and 103 operators with March volumes.
North Dakota March 2026 Production Snapshot
| Metric | Value |
|---|---|
| Latest full modeled production month | March 2026 |
| Modeled oil | 32.1M bbl |
| Modeled gas | 103.2 Bcf |
| Matched production APIs | 19,292 |
| Operators with March volumes | 103 |
| April treatment | Partial rows excluded |
For current Energy-NetWatch app access to well-level records, operator filters, maps, permit follow-up, exports, alerts, and API workflows, request access.
Top Operators By March 2026 Oil
| Operator | Oil | Gas | BOE |
|---|---|---|---|
| Continental Resources | 4.5M bbl | 19.3 Bcf | 7.8M BOE |
| Hess Bakken | 3.1M bbl | 12.6 Bcf | 5.2M BOE |
| Devon Energy Williston | 3.0M bbl | 13.2 Bcf | 5.2M BOE |
| Burlington Resources | 2.6M bbl | 11.5 Bcf | 4.5M BOE |
| Oasis Petroleum | 2.2M bbl | 6.7 Bcf | 3.4M BOE |
| Enerplus Resources USA | 1.9M bbl | 4.3 Bcf | 2.6M BOE |
| Marathon Oil | 1.8M bbl | 4.1 Bcf | 2.5M BOE |
| XTO Energy | 1.8M bbl | 5.5 Bcf | 2.7M BOE |
| Whiting Oil & Gas | 1.4M bbl | 6.1 Bcf | 2.5M BOE |
| Slawson Exploration | 1.4M bbl | 2.4 Bcf | 1.8M BOE |
Continental Resources led the March operator table by both oil and gas volumes in this Energy-NetWatch state-source snapshot. Hess Bakken, Devon Energy Williston, Burlington Resources, and Oasis Petroleum formed the next group by modeled oil volume.
The gas column matters because Bakken follow-up should not be read from oil alone. Devon, Hess, Burlington, XTO, and Whiting all show meaningful gas volumes in this March snapshot, which makes them useful names for operator, well, county, and midstream follow-up workflows.
What This Snapshot Can Support
This is a production-by-operator screen, not a company earnings reconciliation. It is best used for practical follow-up:
| Workflow question | How this table helps |
|---|---|
| Which operators led March oil volume? | Sort by modeled oil and compare the top Bakken operators. |
| Which operators also show large gas volumes? | Read the gas column alongside oil, not after it. |
| Which names should be followed in wells and maps? | Use the top-operator list as a starting point for well-level and county-level review. |
| Why exclude April? | April rows are partial in this pull, so March is the cleaner full-month read. |
The practical next step after a table like this is to move from operator totals into wells, counties, maps, and permits. Operator production totals show scale; well and permit records show where that scale is located and where future activity may be appearing.
Source And Measurement Notes
Energy-NetWatch reviewed modeled North Dakota well production on May 20, 2026.
Figures are modeled well-production records rolled up by operator. Oil and gas are shown in source units. BOE uses gas divided by 6 where referenced. These figures are not company-reported production totals and should not be used as a direct reconciliation to quarterly earnings.
March 2026 is treated as the latest full modeled production month in this pull. April 2026 rows are visible but partial, so they are excluded from the ranking.
FAQ
What is the latest full North Dakota production month in this snapshot?
March 2026 is the latest full modeled production month used for this ranking.
Why are April 2026 rows excluded?
April rows exist in the source pull, but they are partial. Excluding partial rows keeps the operator ranking from mixing full-month and incomplete-month records.
Is this company-reported production?
No. This is Energy-NetWatch modeled well production from North Dakota state-source records rolled up by operator. Company-reported production can use different scopes, assets, working interests, and reporting categories.
What can users do with this in the app?
Energy-NetWatch app users can move from operator totals into wells, counties, maps, permits, exports, alerts, and API workflows.
Request Access
Working with North Dakota operator production, Bakken well follow-up, permit screening, maps, exports, alerts, or API workflows?
Data notes
Energy-NetWatch reviewed modeled North Dakota well production on May 20, 2026. Figures are modeled well-production records rolled up by operator. Oil and gas are shown in source units. BOE uses gas divided by 6 where referenced. April 2026 rows were visible but partial and excluded from the ranking.
Recommended next reads
How to Track Drilling Permits by Operator Before Production Shows Up (2026)
Learn how to track drilling permits by operator, connect permits to later production signals, and avoid common state-source mistakes.
How to Access Free Oil & Gas Production Data Across 26 States (2026 Guide)
Learn where free oil and gas production data comes from, why state records are fragmented, and how EnergyNetWatch tracks 26 states.
Public vs Paid Oil and Gas Data: When State Portals Are Enough (2026)
Compare public vs paid oil and gas data, including state portals, normalized workflows, app access, exports, maps, and public samples.
Why Oil and Gas Data Is Hard to Normalize Across States (2026)
See why oil and gas data normalization is difficult across states, source schemas, identifiers, reporting cadence, permits, and production.
Related EnergyNetWatch pages
Need current records behind this analysis?
Request access for current source refreshes, unmasked well histories, maps, exports, alerts, DCA, economics, and operator workflows.
Request current data access