EOG Q1 2026 Brief: Liquids Guidance and TX/NM Permit-Spud Follow-Through
EOG Q1 2026 results showed higher volumes and raised liquids guidance. Energy-NetWatch adds Texas and New Mexico permit and reported-spud follow-through.
By Johnathan · Reviewed by EnergyNetWatch Research · Last updated 2026-05-15
Key Takeaways
- EOG reported 1,383.8 MBOE/d of Q1 2026 total crude oil equivalent volumes, up 27% year over year.
- EOG raised full-year oil and NGL guidance while keeping the full-year capital expenditure midpoint at $6.5 billion.
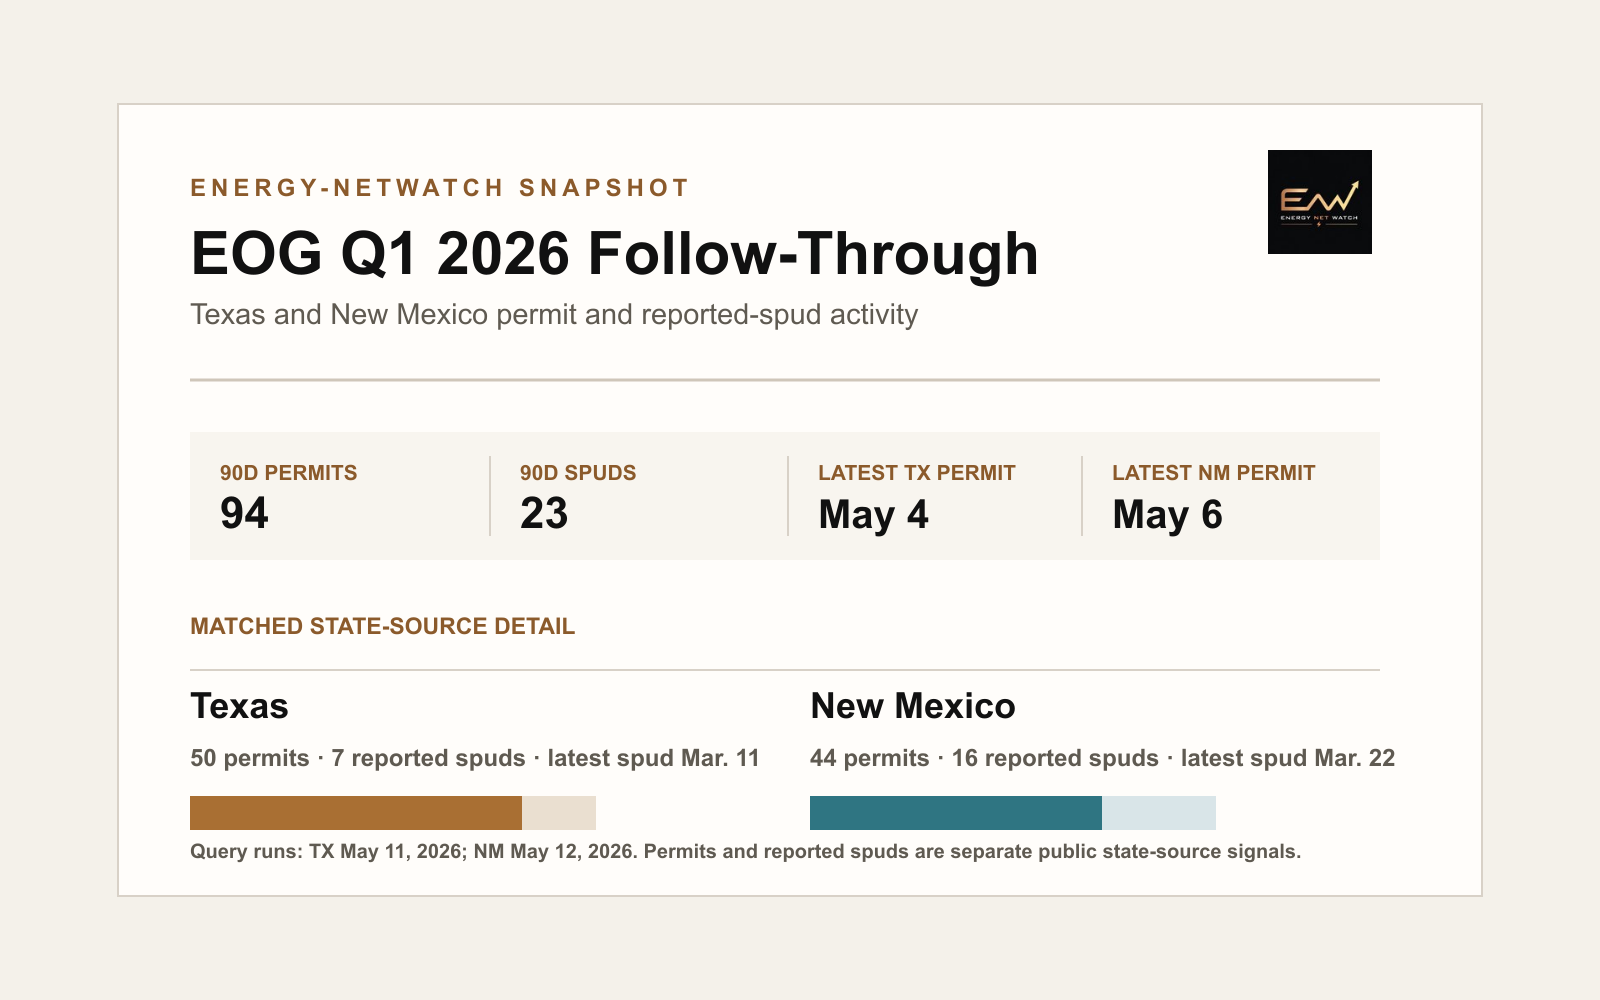
- Energy-NetWatch shows 94 combined EOG-linked trailing 90-day permits and 23 combined reported spuds across the displayed Texas and New Mexico snapshots.
EOG's first-quarter 2026 update showed higher year-over-year production, $1.5 billion of free cash flow, and a modest upward revision to full-year oil and NGL guidance without an increase to the capital budget.
The operating read is direct: EOG reported volumes above its guidance midpoints, costs below guidance midpoints, and a reallocation of capital toward liquids assets for the remainder of 2026. Energy-NetWatch's Texas and New Mexico state-source snapshots add the follow-through layer: recent EOG-linked permits, reported spuds, county concentration, and source timing.
For teams watching EOG activity, the company release answers what changed at the corporate level. The state records help show where public-record activity is appearing after the quarter.
EOG Q1 2026 Company Read
EOG reported first-quarter net income of $2.0 billion, adjusted net income of $1.8 billion, and free cash flow of $1.5 billion. Total crude oil equivalent volumes were 1,383.8 MBOE/d, up 27% from Q1 2025.
| EOG reported | Q1 2026 | Q1 2025 | Change |
|---|---|---|---|
| Total crude oil equivalent volumes | 1,383.8 MBOE/d | 1,090.4 MBOE/d | +27% |
| Crude oil and condensate | 548.5 MBbl/d | 502.1 MBbl/d | +9% |
| Natural gas liquids | 332.1 MBbl/d | 241.7 MBbl/d | +37% |
| Natural gas | 3,020 MMcf/d | 2,080 MMcf/d | +45% |
| Free cash flow | $1.493B | $1.329B | +12% |
| Capital expenditures | $1.636B | $1.484B | +10% |
The U.S. volume line is the relevant starting point for state-source follow-up. EOG reported 546.5 MBbl/d of U.S. crude oil and condensate, up 9% from Q1 2025, and 2,769 MMcf/d of U.S. natural gas, up 51% from Q1 2025.
Management also raised full-year oil and NGL guidance. The release tied that change to reallocating capital toward liquids assets while keeping the full-year capital budget unchanged. EOG's full-year capital expenditure guidance midpoint remained $6.5 billion.
How to Read the Two Data Layers
The company report and the Energy-NetWatch snapshot answer different questions. EOG's release shows company-reported quarterly performance. Energy-NetWatch's state-source view shows public-record activity that can be monitored after the quarter.
| Layer | EOG reported | Energy-NetWatch snapshot |
|---|---|---|
| Scope | Company-reported Q1 2026 results | Matched Texas and New Mexico state-source records |
| Primary use | Production, guidance, capital allocation | Permit, reported-spud, county, and source-timing follow-up |
| Period | Q1 2026 daily averages | May 2026 public-record snapshot windows |
| Key signal | Volumes above guidance; higher oil and NGL guidance | 94 combined 90-day permits; 23 combined 90-day reported spuds |
| Geography | Company portfolio | Texas and New Mexico public records in this brief |
| Measurement | BOE/d, oil, NGL, gas, free cash flow | Permits and reported spuds; not company production reconciliation |
Energy-NetWatch TX/NM State-Source Signal
The Energy-NetWatch follow-through for this brief is concentrated in Texas and New Mexico. This is not a company-wide production reconciliation. It is a public state-source activity read tied to permits and reported spuds.
In the May 2026 Energy-NetWatch permit and spud snapshots, EOG-linked records showed 94 combined trailing 90-day permits across Texas and New Mexico, plus 23 combined reported spuds in the same window.
| Energy-NetWatch matched state-source snapshot | Texas | New Mexico |
|---|---|---|
| 30-day permits | 16 | 17 |
| 90-day permits | 50 | 44 |
| 12-month permits | 146 | 318 |
| 90-day reported spuds | 7 | 16 |
| Latest permit in displayed pull | May 4, 2026 | May 6, 2026 |
| Latest reported spud in displayed pull | Mar. 11, 2026 | Mar. 22, 2026 |
| Main public-record read | Recent Texas permit activity | Lea County spud-heavy New Mexico signal |
Energy-NetWatch public state-source activity snapshot. Company-reported figures and Energy-NetWatch state-source records are separate measurement layers.
New Mexico is the sharper reported-spud signal in this snapshot. EOG ranked fifth by trailing 90-day New Mexico permits among displayed operators, but it had the highest displayed reported-spud count with 16 reported spuds. The operator's New Mexico activity was concentrated in Lea County in the published snapshot.
Texas adds scale and cross-state context. EOG showed 50 trailing 90-day Texas permits and 146 trailing 12-month Texas permits in the Texas snapshot, with the latest displayed permit dated May 4, 2026. The Texas spud signal was lower than New Mexico in the displayed window, with 7 reported spuds in the trailing 90 days.
Follow-Up Signals
| Follow-up signal | What the snapshot shows |
|---|---|
| Texas permits | 50 EOG-linked permits in the trailing 90-day Texas window |
| New Mexico reported spuds | 16 EOG-linked reported spuds in the trailing 90-day New Mexico window |
| Lea County concentration | EOG's New Mexico activity was concentrated in Lea County in the displayed snapshot |
| Latest permit dates | Texas latest permit May 4, 2026; New Mexico latest permit May 6, 2026 |
| Latest reported-spud dates | Texas latest reported spud Mar. 11, 2026; New Mexico latest reported spud Mar. 22, 2026 |
What Changed
At the company level, EOG's Q1 2026 volumes were materially higher than Q1 2025. Natural gas and NGLs had the largest year-over-year percentage increases, while oil and condensate also increased. EOG also raised full-year oil and NGL guidance without raising the capital budget.
The public-record follow-through is more specific. Texas and New Mexico both show EOG-linked recent permit activity, but the two states do not tell the same story in the same way. New Mexico showed fewer EOG 90-day permits than Texas, but more reported spuds in the displayed window. Texas showed a broader trailing permit base.
That distinction is useful because permit counts alone can miss the timing of actual drilling starts. The practical read is to monitor the sequence:
permit -> reported spud -> completion/status update -> first production -> production trend
For EOG, the next public-record checks are straightforward: whether New Mexico reported-spud activity continues, whether Texas reported spuds catch up to recent permits, and whether new permits remain concentrated in core Permian counties.
What To Watch Next
EOG's Q1 update points to three monitoring areas.
First, follow the liquids reallocation. EOG said it is reallocating some 2026 capital toward liquids assets. Texas and New Mexico permit movement are useful public-record indicators after that guidance change.
Second, track New Mexico spud follow-through. In this snapshot, EOG's New Mexico reported spuds stood out relative to its permit rank. That makes Lea County and nearby Delaware Basin records useful follow-up areas.
Third, keep Texas and New Mexico separate before combining them. The two states have different source structures, date fields, reporting cadence, and county context. A cross-state read is more useful when those differences stay visible.
Analyst Takeaway
EOG's Q1 2026 result was a capital-flexibility signal: higher production, strong free cash flow, and higher liquids guidance while holding the capital budget unchanged.
Energy-NetWatch's public-record read adds the operating layer. The May 2026 Texas and New Mexico snapshots show EOG-linked permit and spud activity across both sides of the Permian, with New Mexico showing the stronger reported-spud signal in the displayed window and Texas showing a larger trailing permit base.
For users watching EOG after Q1, the useful workflow is state-by-state: Texas permits, New Mexico reported spuds, county concentration, source freshness, and the lifecycle from permit to production.
Frequently Asked Questions
What did EOG report for Q1 2026 production?
EOG reported total crude oil equivalent volumes of 1,383.8 MBOE/d in Q1 2026, up from 1,090.4 MBOE/d in Q1 2025. Crude oil and condensate volumes were 548.5 MBbl/d, natural gas liquids were 332.1 MBbl/d, and natural gas was 3,020 MMcf/d.
Why does this brief focus on Texas and New Mexico?
Texas and New Mexico are the most relevant public-record layers for the Energy-NetWatch Permian follow-through in this brief. They show recent EOG-linked permits, reported spuds, and source timing across different state systems.
Is the Energy-NetWatch snapshot the same as EOG's reported production?
No. EOG's reported production is a company-reported quarterly metric. Energy-NetWatch state-source snapshots are normalized public records from covered state sources. They are used for operator, state, county, permit, well-level, production-month, and source-freshness follow-up.
Why include spud dates with permits?
Permits show planned activity. Reported spuds show where drilling starts have begun appearing in public records. Reading them together gives a clearer activity signal than using permit counts alone.
Sources
- EOG Resources first-quarter 2026 results release
- EOG Resources first-quarter 2026 results PDF
- Energy-NetWatch Texas drilling permit and spud snapshot, query run May 11, 2026.
- Energy-NetWatch New Mexico drilling permit and spud snapshot, query run May 12, 2026.
Data notes
Company-reported figures are from EOG Resources first-quarter 2026 results. Energy-NetWatch figures are matched Texas and New Mexico public state-source permit and reported-spud snapshots from May 2026, used for source-level monitoring and not as a company-reported production reconciliation.
Recommended next reads
New Mexico Drilling Permits by Operator: May 2026 Permit and Spud Activity Snapshot
New Mexico operators ranked by trailing 90-day drilling permits, reported spuds, Eddy and Lea County concentration, and source freshness.
Texas Drilling Permits by Operator: May 2026 Permit and Spud Activity Snapshot
Texas operators ranked by trailing 90-day drilling permits, with recent reported spuds and source freshness notes from Energy-NetWatch.
How to Track Drilling Permits by Operator Before Production Shows Up (2026)
Learn how to track drilling permits by operator, connect permits to later production signals, and avoid common state-source mistakes.
New Mexico Oil and Gas Production Data: OCD Sources and Public Samples (2026)
Learn how New Mexico oil and gas production data works, where OCD sources fit, and how public EnergyNetWatch samples show Permian context.
Related EnergyNetWatch pages
Need current records behind this analysis?
Request access for current source refreshes, unmasked well histories, maps, exports, alerts, DCA, economics, and operator workflows.
Request current data access