EOG Q1 2026 Brief: Liquids Guidance and TX/NM Permit-Spud Follow-Through
EOG operator intelligence brief covering Texas and New Mexico permits, reported spuds, county follow-through, and Q1 2026 activity context.
By Johnathan · Reviewed by EnergyNetWatch Research · Last updated 2026-06-23
Quarterly/event snapshot
This page is a historical source-record snapshot tied to a specific company update or activity event. It should link back into durable operator and state workflows.
Key Takeaways
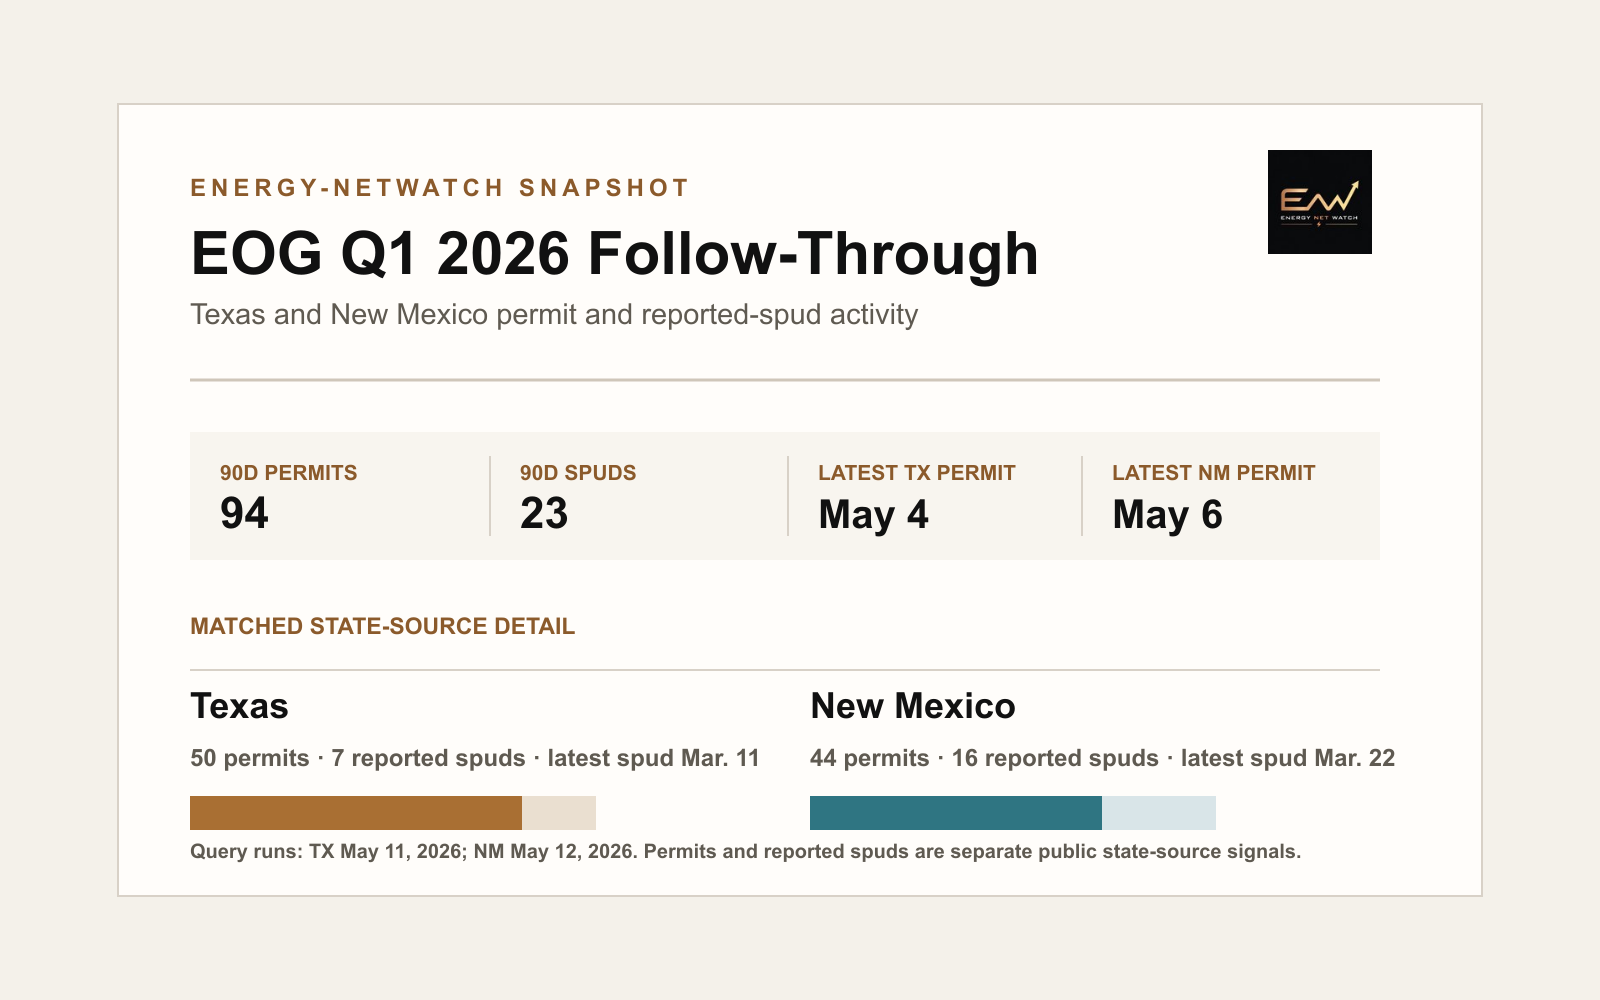
- EOG-linked records show 50 Texas 90D permits and 44 New Mexico 90D permits in the reviewed public snapshots.
- New Mexico shows the stronger reported-spud signal with 16 reported spuds in the 90D window, compared with 7 in Texas.
- The practical workflow is permit-to-spud follow-through, not a company-production reconciliation.
EnergyNetWatch reviewed EOG-linked Texas and New Mexico permit and reported-spud records in May 2026.
Operator Signal
| Field | Current signal |
|---|---|
| Signal grade | Active watchlist |
| Primary source-record use case | Permit-to-spud follow-through across Texas and New Mexico |
| Company-reported Q1 production | 1,383.8 MBOE/d |
| Company-reported oil and condensate | 548.5 MBbl/d |
| EnergyNetWatch 90D permit signal | 94 combined TX/NM permits |
| EnergyNetWatch 90D reported-spud signal | 23 combined TX/NM reported spuds |
| Strongest spud signal | New Mexico, led by Lea County context |
| First follow-up | New Mexico EOG reported-spud table, then Texas permit conversion |
The company release says EOG volumes and liquids guidance moved higher. The source-record question is where public permits are turning into reported drilling-start evidence.
At A Glance
| Field | Current signal |
|---|---|
| Q1 total crude oil equivalent volumes | 1,383.8 MBOE/d |
| Q1 crude oil and condensate | 548.5 MBbl/d |
| Q1 natural gas liquids | 332.1 MBbl/d |
| Q1 natural gas | 3,020 MMcf/d |
| Free cash flow | $1.493B |
| Capital expenditures | $1.636B |
| TX 90D permits | 50 |
| NM 90D permits | 44 |
| TX 90D reported spuds | 7 |
| NM 90D reported spuds | 16 |
EnergyNetWatch public state-source activity snapshot. Company-reported figures and EnergyNetWatch state-source records are separate measurement layers.
What Changed Recently
| Signal | Current signal |
|---|---|
| Company update | Q1 2026 volumes were higher year over year, and EOG raised full-year oil and NGL guidance without raising the capital budget. |
| Texas source signal | 50 trailing-90D permits, 146 trailing-12M permits, and 7 trailing-90D reported spuds. |
| New Mexico source signal | 44 trailing-90D permits, 318 trailing-12M permits, and 16 trailing-90D reported spuds. |
| Timing signal | Latest displayed Texas permit May 4, 2026; latest displayed New Mexico permit May 6, 2026. |
| What to check | New Mexico had the stronger reported-spud signal; Texas had the broader trailing permit base. |
The main signal is not permit count alone. The stronger signal is whether permits are followed by reported spuds.
State-Source Snapshot
| Field | Current signal |
|---|---|
| Texas 30D permits | 16 |
| Texas 90D permits | 50 |
| Texas 12M permits | 146 |
| Texas 90D reported spuds | 7 |
| Texas latest displayed reported spud | March 11, 2026 |
| New Mexico 30D permits | 17 |
| New Mexico 90D permits | 44 |
| New Mexico 12M permits | 318 |
| New Mexico 90D reported spuds | 16 |
| New Mexico latest displayed reported spud | March 22, 2026 |
Texas and New Mexico should stay separate before being combined. The date fields, reporting cadence, and county context are not identical.
Why It Matters
| Buyer question | EnergyNetWatch signal |
|---|---|
| Are permits still moving? | Yes, both Texas and New Mexico show recent EOG-linked permits. |
| Is activity showing drilling-start evidence? | New Mexico shows the stronger reported-spud count in this public pull. |
| First review area | Lea County and nearby Delaware Basin rows, then Texas permit conversion. |
| What should not be claimed? | This is not a company-production reconciliation or proof that every permit has drilled. |
Infrastructure And Midstream Signals
| Layer | Public page treatment | App follow-up |
|---|---|---|
| Facility / midstream records | Not expanded into a public EOG infrastructure lead list. | Review source-linked facility, T-4, produced-water, and county rows around active Delaware Basin permits. |
| Why limited here | The public page proves the permit-to-spud follow-through use case without giving away the current infrastructure table. | Request the current EOG package with permit, spud, facility, map, export, alert, and API fields. |
What To Watch Next
| Watch item | Current signal |
|---|---|
| Liquids reallocation | Watch whether TX/NM permit movement follows the higher liquids guidance. |
| New Mexico reported spuds | Track whether EOG's spud-heavy New Mexico signal continues. |
| Texas conversion | Watch whether Texas reported spuds catch up to the broader permit base. |
| County concentration | Keep Lea County and core Permian counties in the first screen. |
| Lifecycle movement | Follow permit -> reported spud -> completion/status update -> first production -> trend. |
What To Request
The requestable table is:
Request the current EOG Texas/New Mexico permit and reported-spud table.
The export should include operator label, state, county, permit issue date, reported-spud date, source date, well records, map context, alerts, and API delivery options.
Frequently Asked Questions
What did EOG report for Q1 2026 production?
EOG reported total crude oil equivalent volumes of 1,383.8 MBOE/d in Q1 2026, up from 1,090.4 MBOE/d in Q1 2025.
Why does this brief focus on Texas and New Mexico?
Texas and New Mexico are the most relevant public-record layers for the EnergyNetWatch Permian follow-through in this brief.
Is the EnergyNetWatch snapshot the same as EOG's reported production?
No. EOG's reported production is a company-reported quarterly metric. EnergyNetWatch state-source snapshots are normalized public records used for operator, county, permit, well-level, production-month, and source-freshness follow-up.
Why include spud dates with permits?
Permits show planned activity. Reported spuds show where drilling starts have begun appearing in public records.
Sources
- EOG Resources first-quarter 2026 results release
- EOG Resources first-quarter 2026 results PDF
- EnergyNetWatch Texas drilling permit and spud snapshot, query run May 11, 2026
- EnergyNetWatch New Mexico drilling permit and spud snapshot, query run May 12, 2026
Data notes
Company-reported figures are from EOG Resources first-quarter 2026 results. EnergyNetWatch figures are matched Texas and New Mexico public state-source permit and reported-spud snapshots from May 2026, used for source-level monitoring and not as a company-reported production reconciliation.
Recommended next pages
New Mexico Drilling Activity Snapshot: Permits and Reported Spuds by Operator
New Mexico operators ranked by trailing 90-day permit records and independent reported spud records from EnergyNetWatch app data.
Texas Drilling Permits by Operator: May 2026 Permit and Spud Activity Snapshot
Texas operators ranked by trailing 90-day drilling permits, with recent reported spuds and source freshness notes from EnergyNetWatch.
How to Track Drilling Permits by Operator Before Production Shows Up (2026)
Learn how to track drilling permits by operator, connect permits to later production signals, and avoid common state-source mistakes.
New Mexico Oil and Gas Production Data: OCD Sources and Public Samples (2026)
New Mexico OCD oil and gas data guide for production, permits, reported spuds, county context, and EnergyNetWatch source-date workflows.
Related EnergyNetWatch pages
Want the current table behind this analysis?
Public articles use selected examples. Request access if your team needs current source refreshes, exact identifiers, maps, exports, alerts, saved workflows, or API access for this market.