
Matador Resources Operator Activity: NM Permits And Spuds (2026)
Matador Resources operator intelligence brief covering New Mexico permits, reported spuds, wells, production-month context, and Texas facility records.
By Johnathan · Reviewed by EnergyNetWatch Research · Historical report
Historical report
This page is a historical source-record snapshot tied to a specific company update or activity event. It links back into durable operator and state workflows.
Key Takeaways
- MATADOR PRODUCTION COMPANY carried 17 permits in 90D, 226 permits in 12M, 3 reported spuds in 90D, and 74 reported spuds in 12M.
- Lea carried the lead source-record signal with 159 trailing-12-month permits and 62 trailing-12-month reported spuds.
- Texas facility rows are useful support context, but the public permit/spud signal is New Mexico-led in this pull.
EnergyNetWatch reviewed Matador-linked state-source records on June 5, 2026.
Operator Signal
| Field | Current signal |
|---|---|
| Signal grade | Active watchlist |
| Primary source label | MATADOR PRODUCTION COMPANY |
| Permit signal | 17 permits in the reviewed 90D window; 226 permits in the trailing 12M window |
| Spud signal | 3 reported spuds in the reviewed 90D window; 74 reported spuds in the trailing 12M window |
| County concentration | Lea leads the permit/spud signal; Eddy is the second New Mexico layer |
| Production context | 751 New Mexico well records under the current Matador label, with March 2026 production-month context |
| First follow-up | Lea County permit/spud table, then Eddy County source-date watch |
Matador also reported Q1 2026 production and guidance, but the EnergyNetWatch signal is narrower: the public source cut shows where current state records support operator follow-up.
At A Glance
| Field | Current signal |
|---|---|
| Company-reported Q1 production | 207,594 BOE/d |
| Company-reported Q1 oil | 120,277 bbl/d |
| Source-record operator label | MATADOR PRODUCTION COMPANY |
| State-source focus | New Mexico |
| EnergyNetWatch 90D permits | 17 |
| EnergyNetWatch 90D reported spuds | 3 |
| EnergyNetWatch 12M permits | 226 |
| EnergyNetWatch 12M reported spuds | 74 |
| Latest reviewed permit | May 21, 2026 |
| Latest reviewed reported spud | May 6, 2026 |
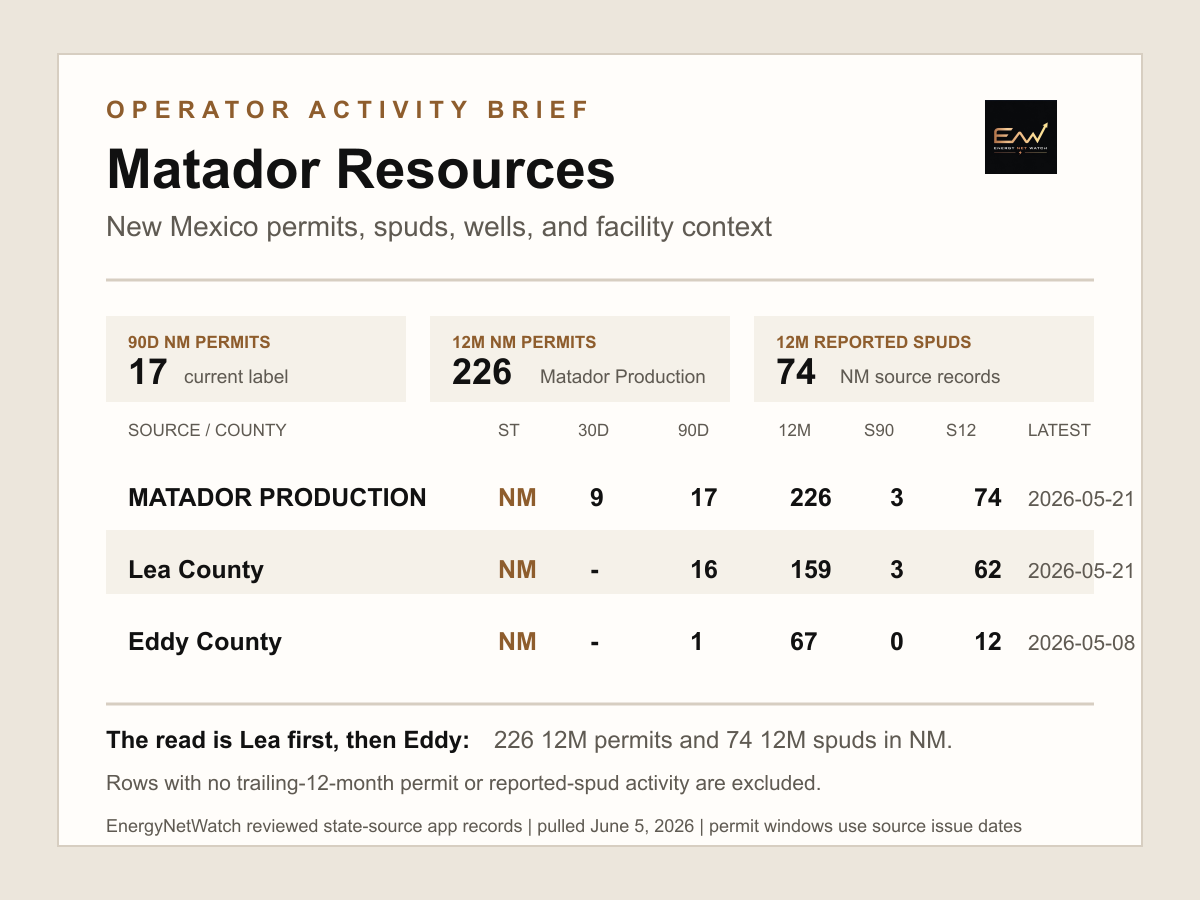
EnergyNetWatch reviewed Matador-linked state-source records, pulled June 5, 2026.
What Changed Recently
| Signal | Current signal |
|---|---|
| Company update | Matador reported Q1 2026 production of 207,594 BOE/d and increased full-year oil and total production guidance |
| State-source permit signal | MATADOR PRODUCTION COMPANY carried 17 permits in 90D and 226 permits in 12M |
| Reported-spud signal | 3 reported spuds in 90D and 74 in 12M |
| County split | Lea carried 159 trailing-12M permits; Eddy carried 67 |
| Source scope | Public current permit/spud table excludes stale or zero-current labels |
The main source-record signal is Lea first, Eddy second.
Lea carried most of the reviewed trailing-12-month permit and reported-spud activity under the current New Mexico Matador label. Eddy still matters, but it is not the lead county in this pull.
Request EnergyNetWatch access to see the current Matador permit/spud table, county fields, maps, exports, alerts, and API options.
Company-Reported Context
Matador announced Q1 2026 results on May 6, 2026. The company reported:
- 207,594 BOE/d of total production
- 120,277 bbl/d of oil production
- 523.9 MMcf/d of natural gas production
- 36.0 net operated wells turned to sales during Q1 2026
- full-year oil production guidance increased to 123,000 to 125,000 bbl/d
- total 2026 capital expenditure guidance reaffirmed at $1.45 billion to $1.55 billion
That company context matters, but it is not the same as the state-source table. The state-source table shows the public-record activity layer to monitor.
State-Source Review
| Field | Current signal |
|---|---|
| Review date | June 5, 2026 |
| 30D permit window | Since May 6, 2026 |
| 90D permit window | Since March 7, 2026 |
| 12M permit window | Since June 5, 2025 |
| Current permit/spud label | MATADOR PRODUCTION COMPANY |
| 30D permits | 9 |
| 90D permits | 17 |
| 12M permits | 226 |
| 90D reported spuds | 3 |
| 12M reported spuds | 74 |
Rows for MATADOR PRODUCTION COMPANY in Texas and Louisiana, ADVANCE ENERGY PARTNERS HAT MESA, LLC, MATADOR OPERATING CO, and San Mateo labels did not carry trailing-12-month permit or reported-spud activity in this pull, so they are not treated as current permit/spud rows here.
County Snapshot
| Field | Current signal |
|---|---|
| Lead county | Lea |
| Lea 12M permits | 159 |
| Lea 90D permits | 16 |
| Lea 12M reported spuds | 62 |
| Lea 90D reported spuds | 3 |
| Eddy 12M permits | 67 |
| Eddy 90D permits | 1 |
| Eddy 12M reported spuds | 12 |
| Eddy 90D reported spuds | 0 |
Lea carried about 70% of the reviewed trailing-12-month permits and about 84% of the reviewed trailing-12-month reported spuds under the current New Mexico Matador label.
Well And Production-Month Context
| Field | Current signal |
|---|---|
| New Mexico Matador well records | 751 |
| New Mexico Matador wells with 2026 production month | 748 |
| New Mexico Matador producing/active status rows | 740 |
| Latest New Mexico production month | March 2026 |
| Texas Matador well records | 162 |
| Texas Matador latest production month | July 2025 |
| Advance Energy Partners Hat Mesa well records | 146 |
| Advance latest production month | March 2026 |
This is source-label context, not a consolidated company production reconciliation.
Production Rollup Pointers
| Field | Current signal |
|---|---|
MATADOR PRODUCTION COMPANY NM operator number | 228937 |
| NM latest production month | March 2026 |
| NM 12M oil | 37,784,839 bbl |
| NM 12M gas | 170,213,065 mcf |
| NM approximate 12M BOE | 66,153,683 BOE |
| NM producing wells in rollup | 733 |
| Advance NM approximate 12M BOE | 8,137,571 BOE |
| Matador TX approximate 12M BOE | 2,309,889 BOE |
The production rows are useful for scale context. They should not be treated as one pro forma Matador company-production total.
Texas Facility Context
EnergyNetWatch records also show Texas facility-permit rows under Matador and San Mateo labels.
| Field | Current signal |
|---|---|
| Matador Loving facility rows | 18 STANDARD_PERMIT_OG / OTHER rows |
| Matador La Salle facility rows | 5 STANDARD_PERMIT_OG / OTHER rows |
| Matador Ward facility rows | 4 STANDARD_PERMIT_OG / OTHER rows |
| San Mateo Wolf Water Resources Loving rows | 3 STANDARD_PERMIT_OG / OTHER rows |
| San Mateo Wolf Pipeline Loving rows | 2 STANDARD_PERMIT_OG / OTHER rows |
This is a source-record table. It is not a capacity, construction-status, or in-service claim.
The public page keeps those rows at category/count level. The current facility lead table, map context, exports, alerts, and API fields are app workflow outputs, not a free public account list.
What To Watch Next
| Watch item | Current signal |
|---|---|
| New Mexico permits | 17 permits in 90D and 226 permits in 12M under MATADOR PRODUCTION COMPANY |
| Reported spuds | 3 reported spuds in 90D and 74 in 12M |
| Lea concentration | Lea carried the strongest reviewed permit/spud row |
| Eddy secondary layer | Eddy carried fewer current permits but remains part of the New Mexico source signal |
| Advance context | Current production-month context exists, but no current permit/spud signal in this pull |
| Texas facilities | Matador and San Mateo facility rows are supporting context, not standalone construction proof |
What To Request
The requestable table is:
Request the current Matador New Mexico permit and reported-spud table.
The export should include operator label, county code, issue date, reported-spud date, source date, well records, production-month context, maps, alerts, and API delivery options.
Frequently Asked Questions
Is this the same as Matador's company-reported production?
No. Company-reported production describes the consolidated corporate reporting view. This brief reviews selected state-source records visible in EnergyNetWatch.
Which operator label is included in the public current permit/spud table?
The public current permit/spud table includes MATADOR PRODUCTION COMPANY in New Mexico. Rows without trailing-12-month permit or reported-spud activity are excluded from that table.
What is the strongest practical takeaway?
Start with New Mexico. In this pull, MATADOR PRODUCTION COMPANY carried 226 trailing-12-month permits and 74 trailing-12-month reported spuds, with Lea carrying the largest county row.
How should Texas facility rows be used?
Facility records should be used as supporting context. They can point to locations and operational context for follow-up, but they are not standalone proof of capacity, construction status, or in-service timing.
Sources
- Matador Q1 2026 results release
- Matador Q1 2026 10-Q filing detail
- SEC 10-Q filing documents
- Matador Q1 2026 presentation
- EnergyNetWatch reviewed state-source app records, pulled June 5, 2026.
Data notes
Company-reported figures are from Matador Resources Q1 2026 results, Form 10-Q, SEC filing documents, and investor-presentation materials reviewed June 5, 2026. EnergyNetWatch figures are reviewed app records pulled June 5, 2026 for selected Matador-linked source labels. Permit, spud, facility, and production dates use different source bases and should not be treated as one company-level production total.
Recommended next pages
New Mexico Drilling Activity Snapshot: Permits and Reported Spuds by Operator
New Mexico operators ranked by trailing 90-day permit records and independent reported spud records from EnergyNetWatch app data.
How to Track Drilling Permits by Operator Before Production Shows Up (2026)
Learn how to track drilling permits by operator, connect permits to later production signals, and avoid common state-source mistakes.
Texas Infrastructure Records: Chase-Ready Oil And Gas Leads (2026)
EnergyNetWatch reviews 36,112 Texas infrastructure records by source date, facility type, operator, county, and chase-ready lead quality.
T-4 Permit Search | Texas RRC Pipeline Permits & GIS Routes
Search Texas RRC T-4 permits by operator, county, and route. Review GIS evidence, source dates, and related PS-48 construction records.
Related EnergyNetWatch pages
Want the current table behind this analysis?
Public articles use selected examples. Request access if your team needs current source refreshes, exact identifiers, maps, exports, alerts, saved workflows, or API access for this market.