New Mexico Drilling Permits by Operator: May 2026 Permit and Spud Activity Snapshot
New Mexico operators ranked by trailing 90-day drilling permits, reported spuds, Eddy and Lea County concentration, and source freshness.
By Johnathan · Reviewed by EnergyNetWatch Research · Last updated 2026-05-13
Key Takeaways
- Permian Resources Operating, LLC led this New Mexico snapshot with 157 permits in the trailing 90-day window.
- Eddy and Lea counties accounted for 653 of the 694 New Mexico permit records in this pull.
- EOG Resources showed the highest displayed reported-spud count, while Permian Resources had the largest displayed permit count.
New Mexico drilling permits are a useful way to follow operator activity before production appears in monthly records. The state is especially important because the public data reflects both Delaware Basin activity in Eddy and Lea counties and non-Permian activity in areas such as Rio Arriba and San Juan counties.
This Energy-NetWatch snapshot ranks New Mexico operators by trailing 90-day permit count and adds context from trailing 30-day permits, trailing 90-day reported spuds, latest permit dates, and county concentration.
The read is specific: which operators are showing recent New Mexico permit activity, where that activity is concentrated, and how much of it has started to appear as reported spud activity. It should be used as an activity snapshot rather than a production, acreage, reserves, or market-size ranking.
For broader context, see the New Mexico oil and gas production data guide, the Texas drilling permits by operator snapshot, and the Energy-NetWatch guide to tracking drilling permits by operator.
Key Takeaways
- Permian Resources Operating, LLC led the 90-day New Mexico permit window with 157 permits and 12 reported spuds in this snapshot.
- Eddy and Lea counties dominated the activity read, accounting for 653 of 694 displayed permit records.
- EOG Resources showed the highest reported-spud count among the displayed operators with 16 reported spuds in the trailing 90-day window.
- Permit counts and spud counts should be read together. Permits show planned activity; reported spuds show where drilling starts have begun appearing in state records.
- The latest permit date in this pull was May 8, 2026, while the latest reported spud date was April 25, 2026.
Source Freshness
| Item | Snapshot value |
|---|---|
| Query run | May 12, 2026 |
| New Mexico permits in 90-day window | 694 |
| New Mexico reported spuds in 90-day window | 85 |
| Latest permit date in pull | May 8, 2026 |
| Latest reported spud date in pull | April 25, 2026 |
Energy-NetWatch uses source-specific date handling for this snapshot. Permit timing uses the state permit issue date when available and falls back to the filed date when needed. Spud timing uses the state-reported spud date.
New Mexico Drilling Permits by Operator: May 2026 Snapshot
In this New Mexico source pull, the trailing 90-day window contained 694 permit records and 85 reported spud records after the filters described below.
| Rank | Operator | Permits 30D | Permits 90D | Permits 12M | Spuds 90D | Top county | Latest permit | Latest spud |
|---|---|---|---|---|---|---|---|---|
| 1 | Permian Resources Operating, LLC | 41 | 157 | 423 | 12 | Eddy | 2026-05-07 | 2026-03-29 |
| 2 | Mewbourne Oil Co | 24 | 70 | 270 | 0 | Eddy | 2026-05-06 | 2026-02-08 |
| 3 | Devon Energy Production Company, LP | 9 | 69 | 502 | 8 | Eddy | 2026-05-04 | 2026-03-06 |
| 4 | XTO Permian Operating LLC | 18 | 59 | 171 | 0 | Eddy | 2026-04-28 | 2025-12-17 |
| 5 | EOG Resources Inc | 17 | 44 | 318 | 16 | Lea | 2026-05-06 | 2026-03-22 |
| 6 | Matador Production Company | 10 | 38 | 234 | 3 | Lea | 2026-05-08 | 2026-04-14 |
| 7 | OXY USA Inc | 6 | 37 | 255 | 0 | Lea | 2026-04-24 | 2025-11-30 |
| 8 | Coterra Energy Operating Co. | 7 | 25 | 70 | 7 | Lea | 2026-05-07 | 2026-04-16 |
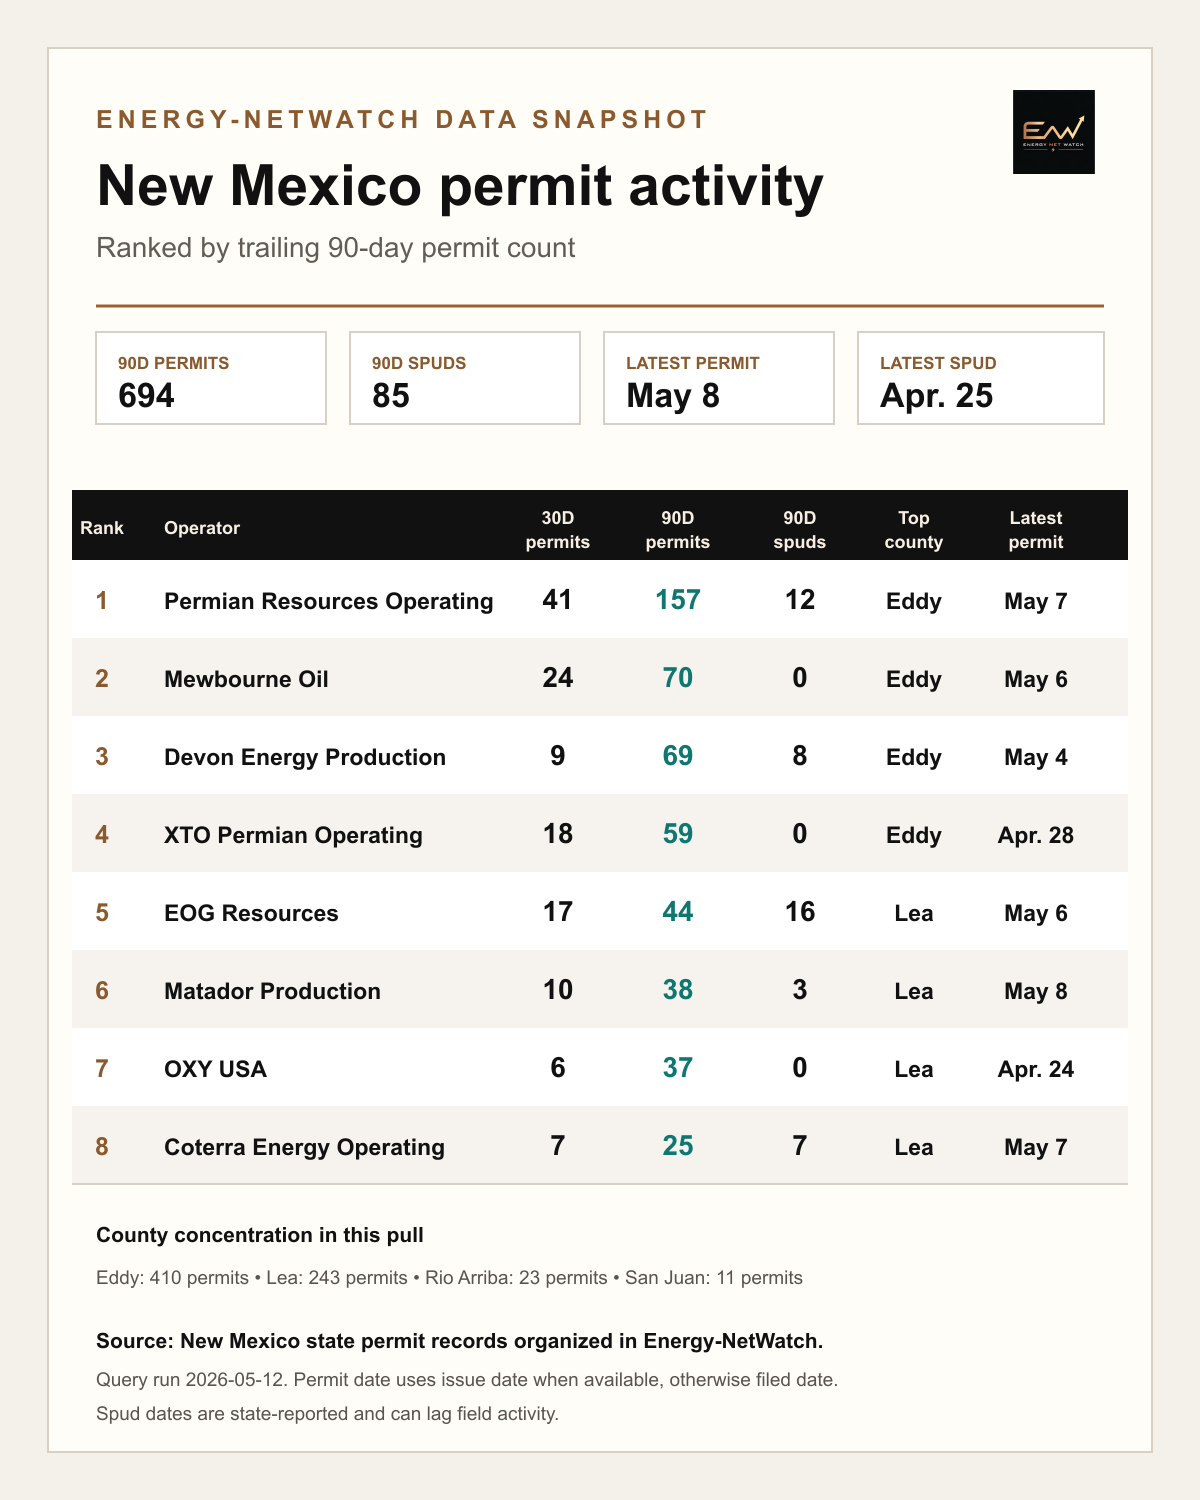
Energy-NetWatch New Mexico permit and spud activity snapshot. Operators are ranked by trailing 90-day New Mexico permit count.
Operator Activity Indicators
The ranking table shows permit count first. Two additional indicators make the operator read more useful:
- 30-day share of 90-day permits: how much of the 90-day permit count came from the most recent 30-day window.
- Reported spuds per 90-day permits: a directional read on how much recent drilling-start activity is visible in the state-reported spud field. This does not mean the same permitted wells have already spudded.
| Operator | Permits 90D | Permits 30D | 30D share of 90D | Spuds 90D | Spuds per 90D permits |
|---|---|---|---|---|---|
| Permian Resources Operating, LLC | 157 | 41 | 26% | 12 | 8% |
| Mewbourne Oil Co | 70 | 24 | 34% | 0 | 0% |
| Devon Energy Production Company, LP | 69 | 9 | 13% | 8 | 12% |
| XTO Permian Operating LLC | 59 | 18 | 31% | 0 | 0% |
| EOG Resources Inc | 44 | 17 | 39% | 16 | 36% |
| Matador Production Company | 38 | 10 | 26% | 3 | 8% |
| OXY USA Inc | 37 | 6 | 16% | 0 | 0% |
| Coterra Energy Operating Co. | 25 | 7 | 28% | 7 | 28% |
This is where the snapshot becomes more than a leaderboard. Permian Resources had the largest permit count, but EOG had the highest displayed reported-spud count. Mewbourne, XTO, and OXY showed meaningful permit counts with little or no reported-spud activity in the displayed 90-day window, which makes them useful follow-up names for future lifecycle monitoring.
Eddy and Lea Counties Drive the New Mexico Permit Read
The New Mexico pull was heavily concentrated in the Delaware Basin.
| County | Permits 90D |
|---|---|
| Eddy | 410 |
| Lea | 243 |
| Rio Arriba | 23 |
| San Juan | 11 |
| Sandoval | 7 |
Eddy County accounted for the largest share of the 90-day permit window, followed by Lea County. Together, those two counties represented the dominant activity signal in this pull.
That matters because a statewide New Mexico count can hide the real geography. A single statewide number may look active, but the useful operating read is usually county-level: where permits are being filed, which operators are filing them, and whether those permits are starting to connect to reported spud activity.
In this pull, Eddy and Lea represented the core New Mexico activity signal. Rio Arriba, San Juan, and Sandoval were visible, but they were much smaller parts of the 90-day permit window.
What Stands Out in This New Mexico Snapshot
Permian Resources Operating, LLC led the displayed group by trailing 90-day permit count, with 157 New Mexico permits and 12 reported spuds in the same 90-day window. The operator's displayed activity was primarily concentrated in Eddy County.
Mewbourne Oil Co and Devon Energy Production Company, LP followed with 70 and 69 trailing 90-day permits, respectively. Devon also showed 8 reported spuds in the recent window.
XTO Permian Operating LLC ranked fourth by 90-day permits, with 59 permits and a latest permit date of April 28, 2026. EOG Resources Inc ranked fifth by permit count but had the largest displayed spud count, with 16 reported spuds in the trailing 90-day window.
Matador Production Company, OXY USA Inc, and Coterra Energy Operating Co. rounded out the displayed group. Matador and Coterra both had latest permit dates in May 2026, and Coterra showed 7 reported spuds in the recent window.
Read this table as a permit and spud activity screen. The operators shown ranked highly in this New Mexico permit snapshot based on the stated window and filters.
The distinction matters for searchers comparing operator activity. A production ranking answers one question. A permit and spud snapshot answers a different question: where near-term drilling activity is appearing in state records.
New Mexico Versus the Texas Permit Snapshot
The New Mexico snapshot is also useful next to the Texas permit snapshot because the two states show different activity patterns and source timing.
| Snapshot | Permits 90D | Reported spuds 90D | Latest permit date | Latest reported spud date | Primary read |
|---|---|---|---|---|---|
| New Mexico | 694 | 85 | May 8, 2026 | April 25, 2026 | Concentrated in Eddy and Lea counties |
| Texas | 1,762 | 192 | May 6, 2026 | April 1, 2026 | Larger statewide permit base with broader operator geography |
Texas had the larger permit base in the published Energy-NetWatch snapshot. New Mexico was smaller by count, but the activity signal was more concentrated around Eddy and Lea counties. For Permian monitoring, that distinction matters. A cross-state read should not treat Texas and New Mexico as interchangeable source systems.
The practical workflow is to use Texas for broader statewide operator movement and New Mexico for a concentrated Delaware Basin read, then connect both states back to wells, production, maps, and operator history.
Operators To Monitor Next
This snapshot points to four follow-up groups:
| Follow-up group | Why it matters |
|---|---|
| High permit count | Permian Resources, Mewbourne, Devon, and XTO had the largest displayed 90-day permit counts. |
| High reported-spud activity | EOG, Permian Resources, Devon, and Coterra showed the most displayed reported spuds. |
| Recent permit freshness | Matador, Permian Resources, Coterra, Mewbourne, EOG, and Devon all had latest permit dates in May 2026. |
| Permit-heavy, spud-light names | Mewbourne, XTO, and OXY are useful follow-up names because reported spud activity may appear later or through a different timing pattern. |
Read these as public-record monitoring priorities from this permit/spud snapshot.
How to Read the New Mexico Permit and Spud Table
The table is designed to separate early activity signals from later source confirmations.
| Field | How to read it |
|---|---|
| Permits 30D | Very recent permit activity. Useful for spotting fresh operator movement. |
| Permits 90D | The ranking window for this snapshot. Less noisy than a 30-day view. |
| Permits 12M | Broader permit footprint over the trailing year. |
| Spuds 90D | State-reported drilling starts in the recent window. |
| Top county | The county with the largest 90-day permit count for that operator in this pull. |
| Latest permit | Latest permit date found in the operator record set. |
| Latest spud | Latest state-reported spud date found in the operator record set. |
A permit is not the same as a producing well. A reported spud is also not the same as first production. The useful workflow is to connect the lifecycle:
permit -> reported spud -> completion/status update -> first production -> production trend
Each step can move on a different source calendar. That is why Energy-NetWatch presents permit and spud timing with source freshness notes.
Why This New Mexico Snapshot Is Different From Texas
The New Mexico read is useful because it gives a second state-source view into Permian activity.
Texas and New Mexico both matter for Permian workflows, but the source structures, reporting cadence, operator labels, county geography, and permit fields are not identical. A cross-state workflow has to preserve those differences instead of forcing both states into a single flat table without source context.
In this pull, New Mexico showed a clearer county concentration around Eddy and Lea. Texas, by contrast, is broader and often requires additional county, district, field, and lease-level context before the activity signal is as easy to interpret.
The benefit of putting Texas and New Mexico side by side is not just having more rows. It is being able to compare operator activity across different state systems without losing the source-specific details that make the data reliable.
Data Notes
This snapshot uses New Mexico state permit records organized in Energy-NetWatch.
Definitions used:
- New Mexico records only.
- Operators ranked by trailing 90-day New Mexico permit count.
- Permit date uses the permit issue date when available, otherwise the filed date.
- Spud date uses the state-reported spud date.
- Canceled permits were excluded where identifiable.
- County concentration uses New Mexico county-code mapping where county name is not directly populated.
- Query run: May 12, 2026.
- Max New Mexico permit date in table: May 8, 2026.
- Max reported New Mexico spud date in table: April 25, 2026.
Where Energy-NetWatch Fits
New Mexico permit data is public. The harder part is keeping it usable across operators, counties, wells, spud timing, production history, and cross-state Permian workflows.
Energy-NetWatch is built around that workflow: organizing public oil and gas records so teams can review operator activity, source freshness, permit movement, production history, and map context without rebuilding the same joins every week.
For current operator records, full permit tables, wells, maps, production history, exports, and alert workflows, request Energy-NetWatch access.
Frequently Asked Questions
What is a New Mexico drilling permit?
A New Mexico drilling permit is a public regulatory record tied to planned drilling activity. It can indicate where an operator has received authorization to drill, but it does not prove that the well has been drilled, completed, or placed on production.
Why rank New Mexico operators by trailing 90-day permits?
A 90-day window is recent enough to show current activity, but less noisy than a 30-day snapshot. It is useful for comparing recent permit movement across operators without treating a single week as the whole trend.
Why do Eddy and Lea counties matter?
Eddy and Lea counties are central to New Mexico Delaware Basin activity. In this pull, they accounted for most of the trailing 90-day New Mexico permit activity shown in the snapshot.
Are spud dates the same as production dates?
No. A spud date indicates a reported drilling start. Production appears later after the well is completed, placed on production, and reported through the relevant state source.
Is this a complete ranking of New Mexico oil and gas operators?
No. This is a permit and spud activity snapshot ranked by trailing 90-day permit count. It is not a ranking by production, acreage, reserves, inventory, revenue, or company size.
Why does Energy-NetWatch include data freshness notes?
Public oil and gas sources move on different calendars. Permit records, spud records, completion records, and production records can update at different times. Freshness notes help users understand what the table can and cannot support.
Data notes
This Energy-NetWatch snapshot uses New Mexico state permit records. Permit date uses issue date when available, otherwise filed date. Spud date uses the state-reported spud date. Canceled permits were excluded where identifiable. Query run May 12, 2026.
Recommended next reads
Texas Drilling Permits by Operator: May 2026 Permit and Spud Activity Snapshot
Texas operators ranked by trailing 90-day drilling permits, with recent reported spuds and source freshness notes from Energy-NetWatch.
New Mexico Oil and Gas Production Data: OCD Sources and Public Samples (2026)
Learn how New Mexico oil and gas production data works, where OCD sources fit, and how public EnergyNetWatch samples show Permian context.
How to Track Drilling Permits by Operator Before Production Shows Up (2026)
Learn how to track drilling permits by operator, connect permits to later production signals, and avoid common state-source mistakes.
Texas Oil and Gas Production Data: RRC Records and Public Samples (2026)
Understand Texas oil and gas production data, RRC reporting limits, public sample trends, and when normalized app workflows help.
Related EnergyNetWatch pages
Need current records behind this analysis?
Request access for current source refreshes, unmasked well histories, maps, exports, alerts, DCA, economics, and operator workflows.
Request current data access