Tracking Active Drilling Rigs Without Expensive GPS Feeds
Baker Hughes tells you how many rigs are in the Permian. It doesn't tell you where. By combining public drilling permits with state-reported spud dates, EnergyNetWatch infers active rig locations at a fraction of the cost of $75,000/yr GPS telemetry feeds.
By Johnathan · Reviewed by EnergyNetWatch Research · Last updated 2026-04-27
Key Takeaways
- Baker Hughes rig counts are aggregate national metrics — they don't tell you who is drilling, or exactly where.
- Every state requires a public permit before drilling and a spud date report within 24 hours of breaking ground — creating a real-time inference signal.
- The permit-to-spud window (15–25 days for a modern horizontal) reliably identifies which coordinates have a rig on them right now.
The Baker Hughes Rig Count is arguably the oil and gas industry's most intensely watched weekly metric. When the Friday report hits the wire, commodity traders react, exploration budgets are scrutinized, and Wall Street adjusts its macro models.
But the Baker Hughes dataset has a fundamental flaw for local operators and service companies: it is an aggregate. It tells you exactly how many rigs are in the Permian Basin, but it doesn't tell you where those rigs are specifically located, who is operating them, or what they are drilling.
To find exact rig locations, companies historically have had only one choice: buy proprietary GPS tracking feeds from enterprise data providers who either place transponders directly on the rigs or purchase expensive daily satellite imagery.
These GPS telemetry feeds frequently cost upwards of $50,000 to $75,000 per year.
But there is another way. By utilizing simple queuing theory and extracting the exact time gap between public drilling permits and state-reported spud dates, it is entirely possible to infer active rig locations with immense accuracy — for free.
The Permit-to-Spud Signal
Before an operator can drop a drill bit into the ground in Texas, they must file a W-1 Drilling Permit with the Texas Railroad Commission. These permits are public record and contain the exact latitude, longitude, and intended target formation of the well — all indexed by a unique API well number.
When the rig actually arrives on the pad and begins drilling, Texas requires operators to report the spud date within 24 hours of breaking ground through the RRC's electronic filing system.
This is all the data a well-calibrated inference engine needs.
How the Inference Model Works
Rather than tracking the steel rig itself, we track the bureaucracy surrounding it.
- Scan the Queue: Continuously monitor all drilling permits filed across the basin over the last 90 days.
- Identify the Active Window: Filter the database for wells that have officially reported a
spud_datebut have not yet reported a completion or first production. - Calculate Cycle Time: Because a modern horizontal rig takes 15 to 25 days to drill a well (depending on depth and basin), a well sitting within this narrow temporal window is very likely to have an active rig on location.
- Plot the Location: Map the permit's geo-coordinates to the UI, allowing users to visually see the probable location of the rig.
Accuracy Comparisons
How good is inference compared to a $50k GPS tracker? Surprisingly close.
| Metric | GPS Feed | Permit-Spud Inference |
|---|---|---|
| Coordinate accuracy | Meter-level | Survey/section level (~1 sq. mile) |
| Update frequency | Real-time | 3–10 day lag (state filing delay) |
| Operator attribution | Yes | Yes (from permit record) |
| Rig contractor name | Yes | Partial (parsed from permit PDFs) |
| Annual cost | $50,000–$75,000 | Included in platform |
Volume calibration check: If Baker Hughes reports 230 rigs in Texas, and each rig spuds approximately 1.0 to 1.5 wells per month (depending on well depth and pad efficiency), the inference algorithm expects to see 230–345 new spud signals appear within a 30-day rolling window. When those counts consistently track the Baker Hughes trend line, the model is mathematically validated against the industry's own benchmark.
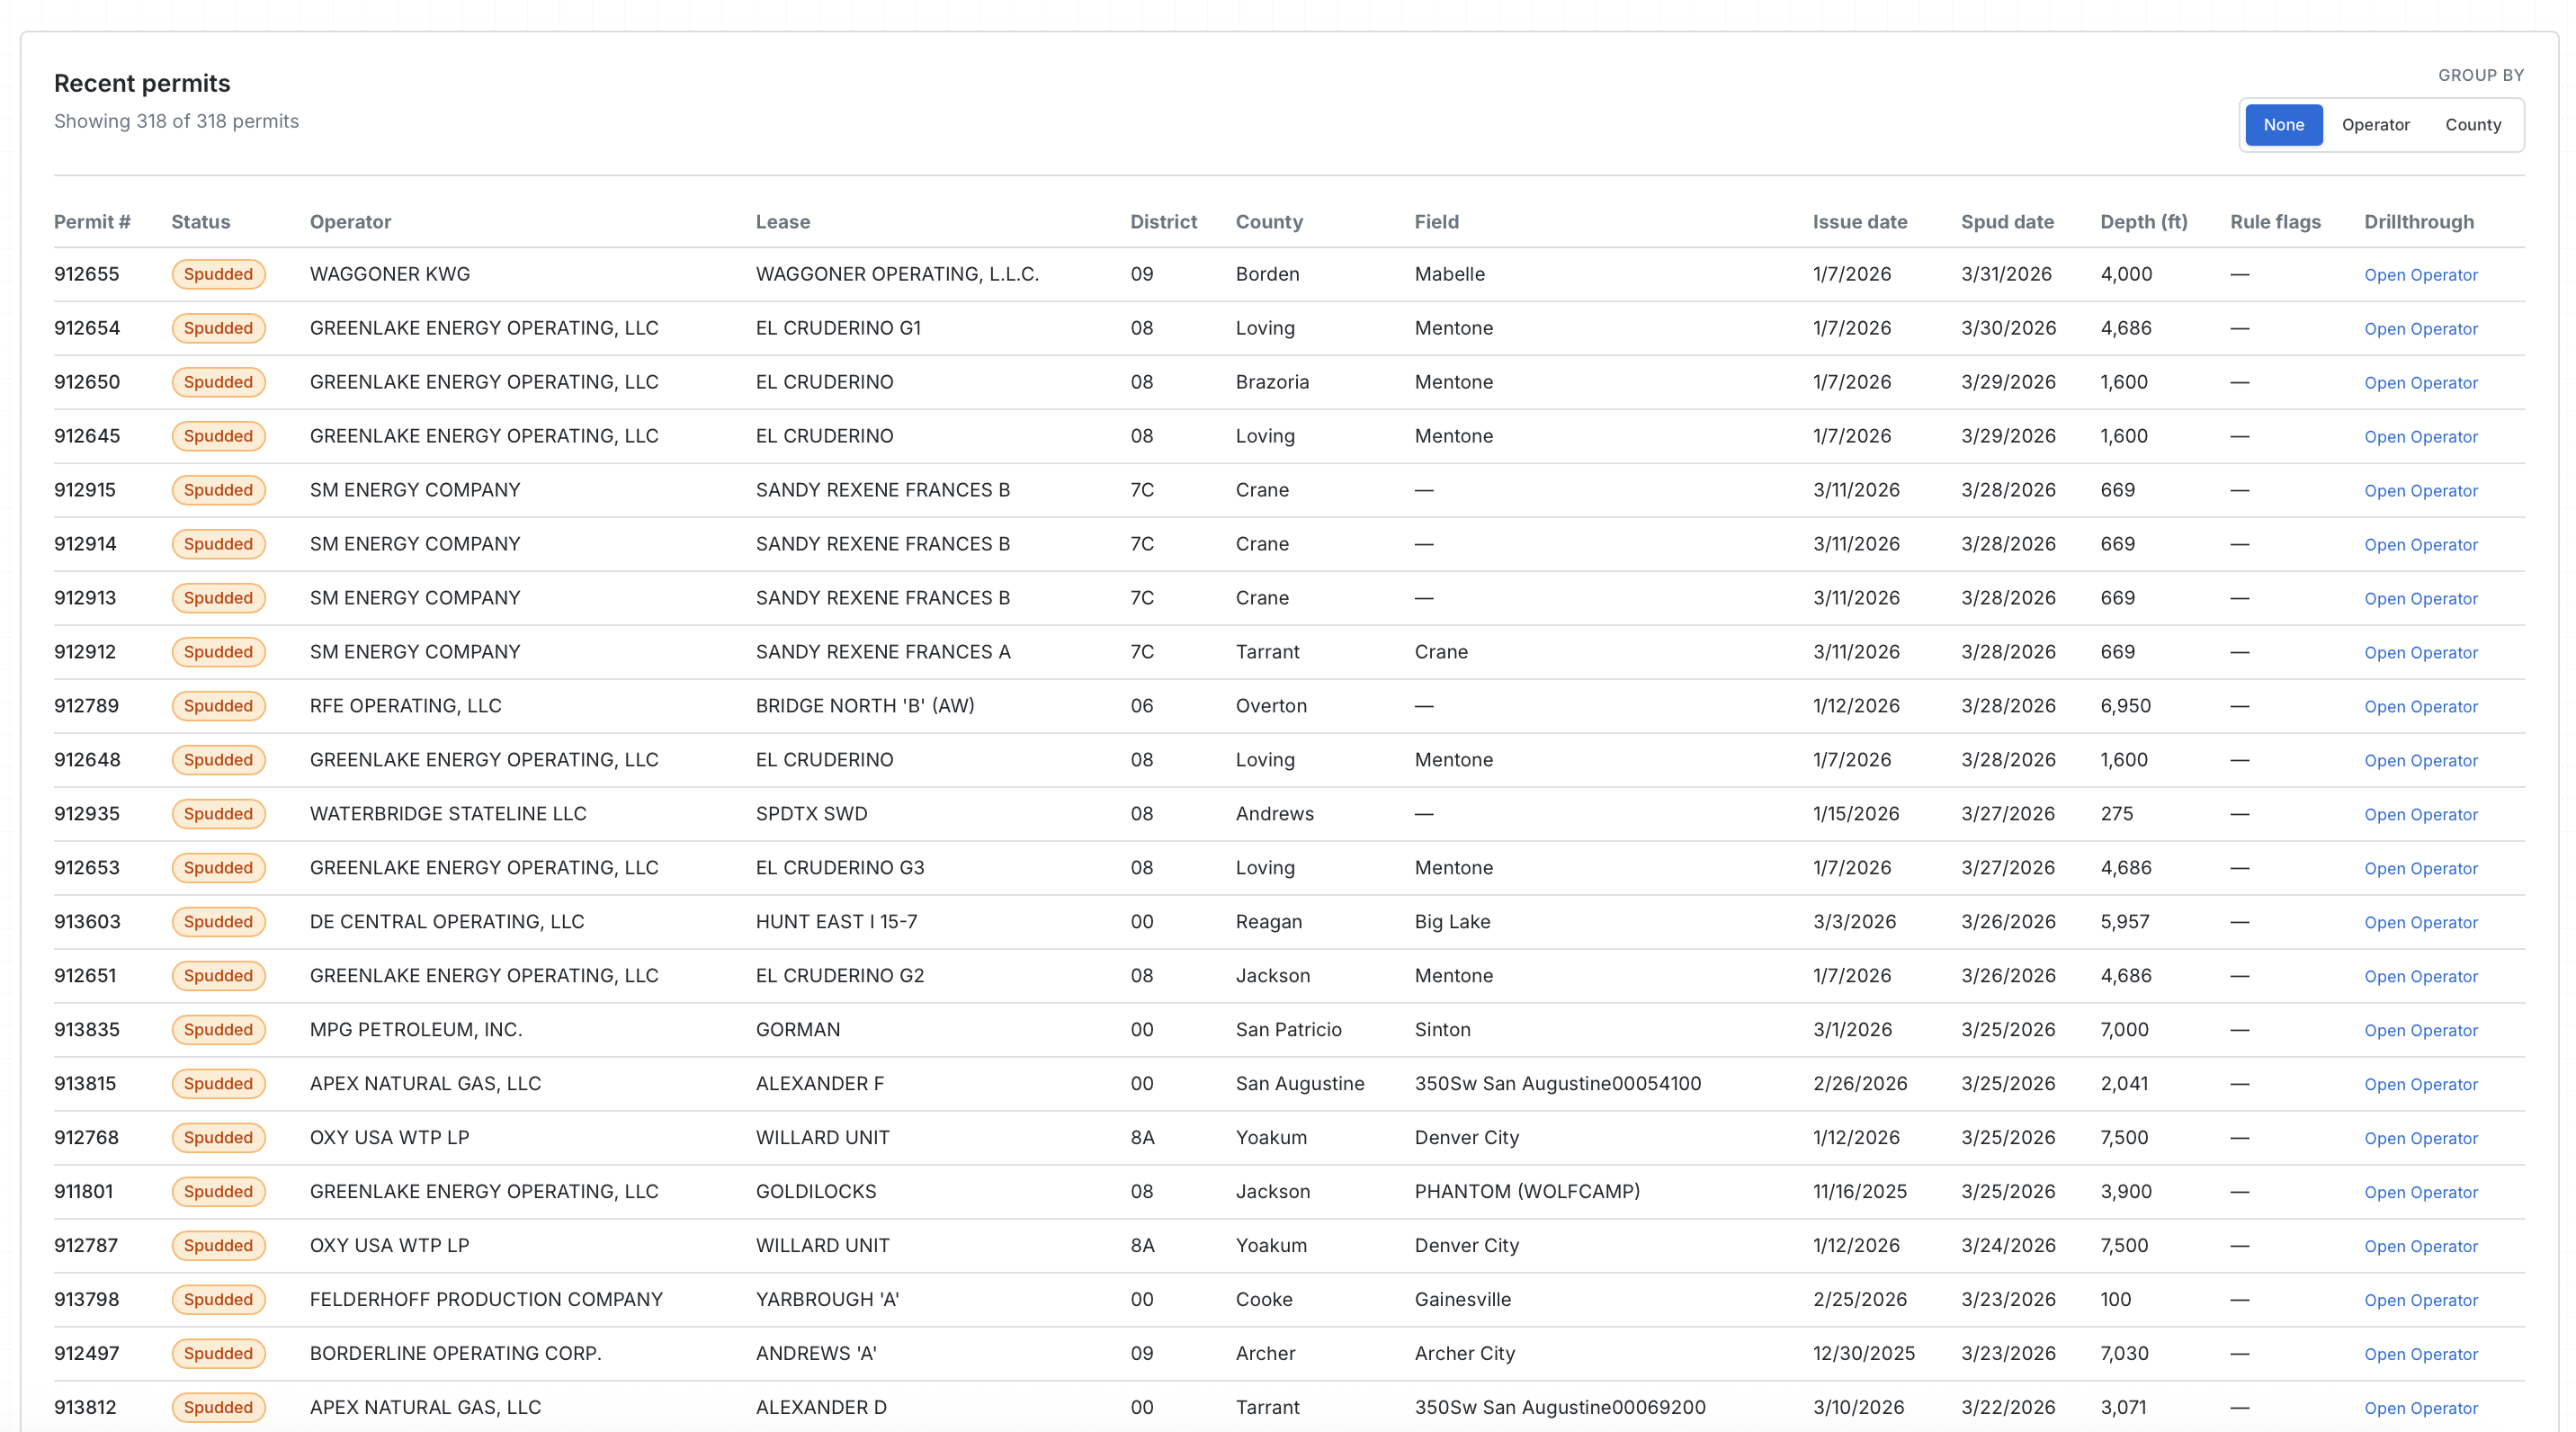 The EnergyNetWatch Permits view surfaces the raw signal: 318 permits with Spudded status, each with a verified issue date and spud date. This is the data the inference model works from — all sourced from public RRC filings.
Why "Micro" Rig Data Matters
The Baker Hughes weekly number tells you the macro story of the US economy. But the active drilling map tells you the micro story necessary for business development:
Service Company Prospecting If you sell wireline services, frac sand, or water hauling, you don't care about the national average. You want to see exactly which operators are actively drilling uncompleted wells in your immediate operating radius so your sales team can target them before the competition does.
Operator Competitive Intelligence Are your multi-billion dollar neighbors ramping up their drilling programs adjacent to your leasehold, or have they pulled their rigs to another county? Active spud signals answer this question three weeks before any production data surfaces.
Farm-In Opportunities A heavy cluster of active drilling signals high geological confidence, pinpointing the exact frontier where an operator might be willing to farm out adjacent acreage.
In the EnergyNetWatch platform: The Workflows section surfaces modeled rig activity by operator and county, layered over the permit queue — so you can see where capital is actually being deployed right now, not 60 days from now when production starts flowing.
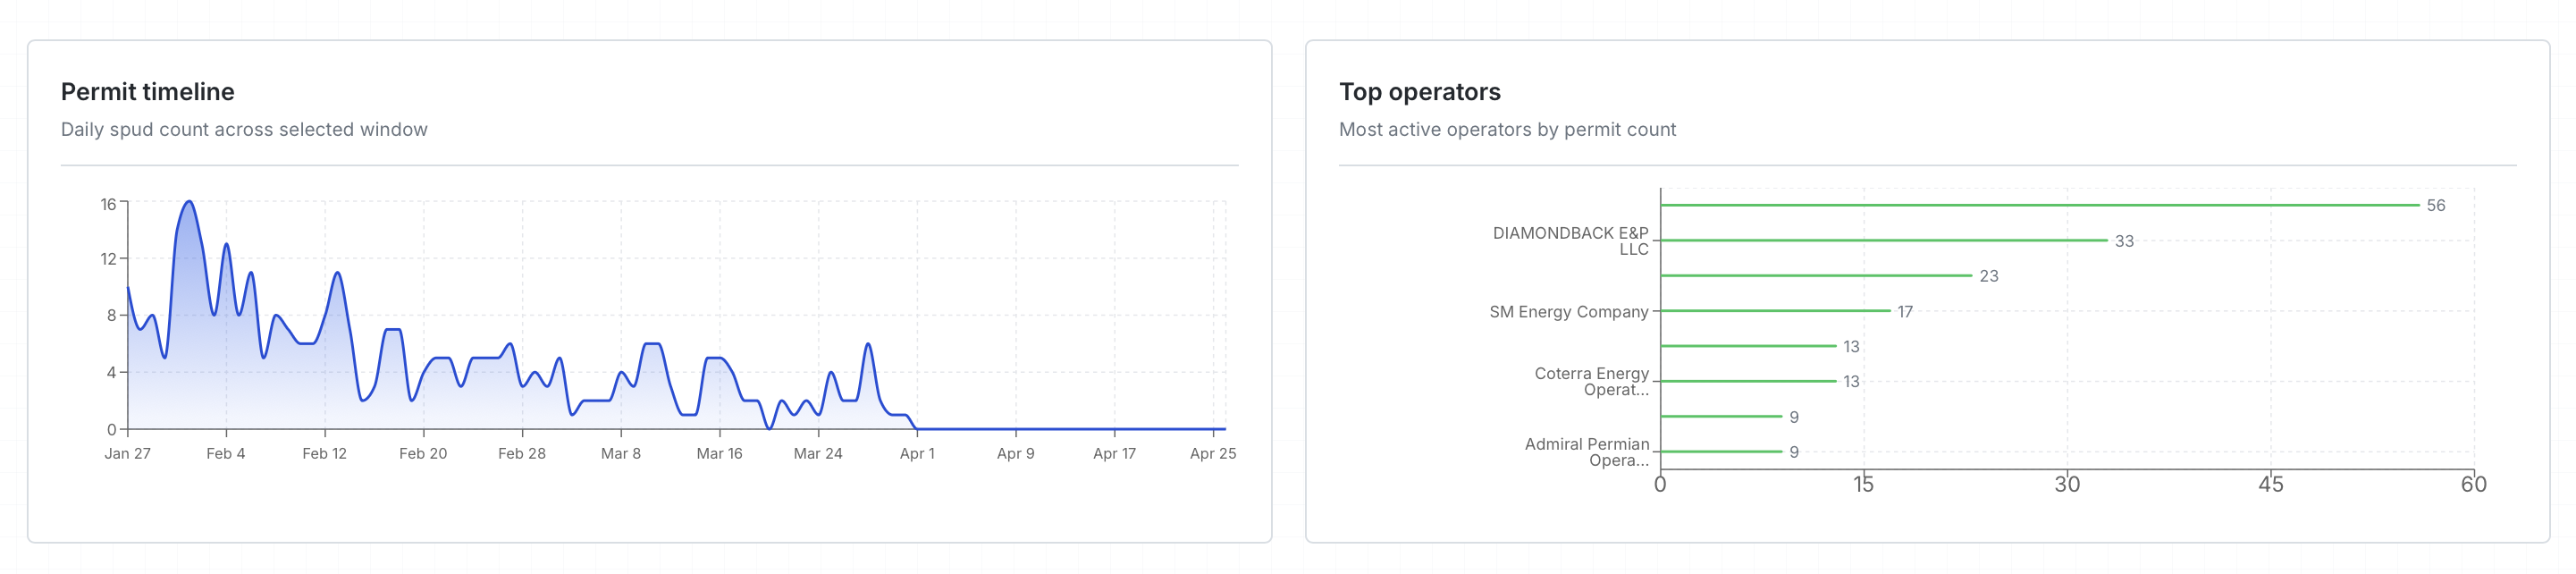 Daily spud count across a 90-day window (left) alongside top operators by permit count (right). Diamondback E&P leads with 56 active permits — the kind of operator-level drilling intelligence that was previously locked behind $75,000/yr GPS subscriptions.
Limitations (The Honest Disclaimer)
This approach is highly effective, but we build data products for engineers — so we are going to be completely transparent about the limitations of spud-inference:
Lag time exists. If a rig finishes drilling on a Tuesday and moves to a pad three miles away on a Wednesday, the inference model might not reflect that move until the state updates the registry paperwork 7–10 days later. This is a regulatory filing delay, not a platform limitation.
Rig contractor names require extra parsing. The standard permit record doesn't include the contractor. However, D-1A PDF parsing can extract names like Helmerich & Payne Fleet 45 — EnergyNetWatch processes these automatically where the PDFs are available.
Multi-well pads require de-duplication. One rig drilling four closely stacked wells on a single pad can occasionally generate multiple signals if the algorithm isn't correctly de-duplicating by surface hole coordinates and operator.
This is not a replacement for real-time, second-by-second transponder tracking if you are dispatching emergency logistics to a rig site. But it is an incredibly high-value, 90% solution for analysts, mineral buyers, and service companies who need directional intelligence without the enterprise subscription fee.
Frequently Asked Questions
How accurate is permit-spud inference compared to real GPS data? Coordinate accuracy is at the survey/section level — roughly one square mile for the surface hole location. For competitive intelligence, prospecting, and monitoring, this is more than sufficient. For real-time logistics dispatch, a GPS feed remains the right tool.
How often is the data updated? EnergyNetWatch refreshes permit and spud data on a rolling basis. State filing delays (typically 3–10 business days) introduce the primary lag — not the platform's ingestion frequency.
Does this work outside Texas? Yes. New Mexico OCD, Colorado COGCC, Wyoming Oil and Gas Commission, and North Dakota DMR all require similar permit-to-spud reporting. The inference model applies to any state with public electronic permit and spud date records.
Can I see which service company is on location? Where D-1A PDF data is available, the platform parses contractor and rig names automatically. Coverage varies by state and operator filing behavior.
The oil and gas industry has a long history of charging premium prices for basic data aggregation. The spud-to-rig inference engine proves that with smart engineering and public regulatory data, you can build the same intelligence moat for a fraction of the cost.
Data notes
Cycle time ranges (15–25 days) are based on Permian Basin horizontal well norms as of 2025–2026. GPS feed pricing reflects publicly referenced enterprise data subscription ranges. State filing lag estimates based on observed RRC and OCD update cadences.
Recommended next reads
How to Track Drilling Permits by Operator Before Production Shows Up (2026)
Learn how to track drilling permits by operator, connect permits to later production signals, and avoid common state-source mistakes.
Texas Oil and Gas Production Reporting: RRC Data and Public Samples (2026)
Texas oil and gas production reporting guide covering RRC production lag, public samples, operator labels, and EnergyNetWatch workflows.
New Mexico Oil and Gas Production Data: OCD Sources and Public Samples (2026)
New Mexico OCD oil and gas data guide for production, permits, reported spuds, county context, and EnergyNetWatch source-date workflows.
Related EnergyNetWatch pages
Want the current table behind this analysis?
Public articles use selected examples. Request access if your team needs current source refreshes, exact identifiers, maps, exports, alerts, saved workflows, or API access for this market.