Texas Drilling Permits by Operator: May 2026 Permit and Spud Activity Snapshot
Texas operators ranked by trailing 90-day drilling permits, with recent reported spuds and source freshness notes from Energy-NetWatch.
By Johnathan · Reviewed by EnergyNetWatch Research · Last updated 2026-05-12
Key Takeaways
- Diamondback E&P LLC led this Texas snapshot with 159 permits in the trailing 90-day window.
- Pioneer Natural Res. USA, Inc. had the highest reported 90-day spud count among the displayed operators.
- Permit dates and spud dates are best read together because state-reported spud timing can lag field activity.
Texas drilling permits are one of the earlier public signals of oil and gas activity. Production records show what has already been reported. Permits and spud dates help show where operator activity is moving before production appears in the monthly data.
This Energy-NetWatch snapshot ranks Texas operators by trailing 90-day permit count and adds three context fields: trailing 30-day permits, trailing 12-month permits, and trailing 90-day reported spuds. It is a public data snapshot, not a complete operator ranking by acreage, production, inventory, or market value.
The point is narrower: which operators show recent Texas permit activity, and which of those permits are starting to connect to reported drilling activity?
For broader context, see the Texas oil and gas production data guide and the Energy-NetWatch guide to tracking drilling permits by operator.
Texas Drilling Permits by Operator: May 2026 Snapshot
In this Texas source pull, the trailing 90-day window contained 1,762 permit records and 192 reported spud records after the filters described below.
| Rank | Operator | Permits 30D | Permits 90D | Permits 12M | Spuds 90D | Latest permit | Latest spud |
|---|---|---|---|---|---|---|---|
| 1 | Diamondback E&P LLC | 19 | 159 | 359 | 18 | 2026-04-29 | 2026-03-22 |
| 2 | Pioneer Natural Res. USA, Inc. | 2 | 138 | 376 | 43 | 2026-04-30 | 2026-03-13 |
| 3 | EOG Resources, Inc. | 16 | 50 | 146 | 7 | 2026-05-04 | 2026-03-11 |
| 4 | Apache Corporation | 11 | 45 | 93 | 6 | 2026-05-01 | 2026-02-28 |
| 5 | OXY USA Inc. | 14 | 38 | 74 | 0 | 2026-05-01 | 2025-11-24 |
| 6 | DE Central Operating, LLC | 12 | 37 | 105 | 4 | 2026-05-01 | 2026-03-27 |
| 7 | Ovintiv USA Inc. | 6 | 34 | 53 | 4 | 2026-04-29 | 2026-02-23 |
| 8 | Anadarko E&P Onshore LLC | 8 | 30 | 99 | 4 | 2026-04-13 | 2026-03-02 |
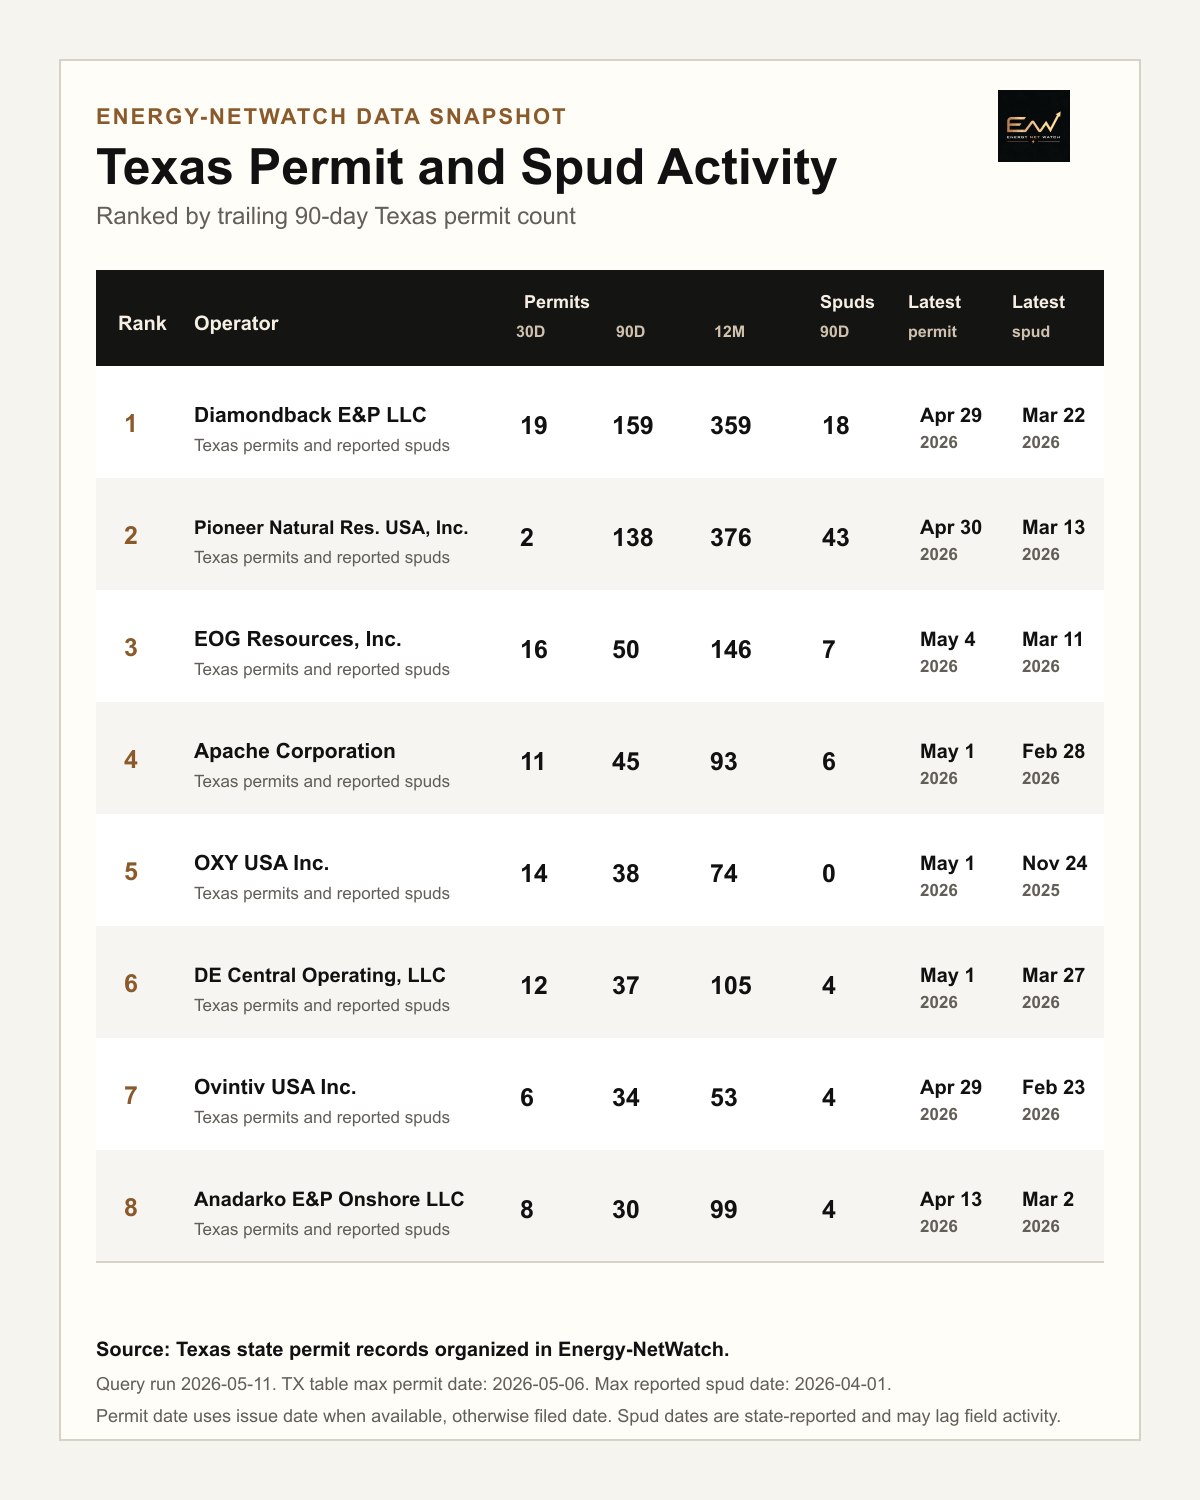
Energy-NetWatch Texas permit and spud activity snapshot. Operators are ranked by trailing 90-day Texas permit count.
How to Read the Texas Permit and Spud Table
The table is designed to keep the activity signal simple.
| Field | How to read it |
|---|---|
| Permits 30D | Very recent permit activity. Useful for spotting fresh operator movement. |
| Permits 90D | The ranking window for this snapshot. Less noisy than a 30-day view. |
| Permits 12M | Broader permit footprint over the trailing year. |
| Spuds 90D | State-reported drilling starts in the recent window. |
| Latest permit | Latest permit date found in the operator record set. |
| Latest spud | Latest state-reported spud date found in the operator record set. |
A permit is not the same as a producing well. A reported spud is also not the same as first production. The useful workflow is to connect the lifecycle:
permit -> reported spud -> completion/status update -> first production -> production trend
Each step can move on a different source calendar. That is why Energy-NetWatch presents permit and spud timing with source freshness notes.
What Stands Out in This Texas Operator Snapshot
Diamondback E&P LLC led the displayed group by trailing 90-day permit count, with 159 Texas permits and 18 reported spuds in the same 90-day window.
Pioneer Natural Res. USA, Inc. had fewer trailing 30-day permits in this pull, but the highest displayed reported spud count, with 43 reported spuds in the trailing 90-day window. That difference is why permit counts and spud records are best read together instead of treated as the same signal.
EOG Resources, Inc., Apache Corporation, OXY USA Inc., DE Central Operating, LLC, Ovintiv USA Inc., and Anadarko E&P Onshore LLC all showed recent Texas permit activity with latest permit dates in April or May 2026.
This does not mean these are the largest Texas producers or the most active operators by every measure. It means they ranked highly in this Texas permit snapshot based on the stated window and filters.
Why Spud Dates Matter Alongside Texas Permits
Permits are useful because they can appear before production. But permit counts alone can overstate near-term field activity if the permitted wells have not moved forward.
Spud dates add another layer. They help show where permitted activity has started to become drilling activity, once that event is reported into the public source.
The timing gap matters:
| Signal | What it tells you | Limitation |
|---|---|---|
| Permit | Authorization/planned activity | Not every permit becomes a drilled well on the same timeline |
| Spud | Reported drilling start | State-reported dates can lag field activity |
| Production | Volumes after reporting begins | Usually appears after a longer source lag |
For operator monitoring, the best read is not one number. It is the sequence across permits, reported spuds, completions or status records, and production.
Data Notes
This snapshot uses Texas state permit records organized in Energy-NetWatch.
Definitions used:
- Texas records only.
- Operators ranked by trailing 90-day Texas permit count.
- Permit date uses the permit issue date when available, otherwise the filed date.
- Spud date uses the state-reported spud date.
- Canceled permits were excluded where identifiable.
- Query run: May 11, 2026.
- Max Texas permit date in table: May 6, 2026.
- Max reported Texas spud date in table: April 1, 2026.
County concentration is intentionally excluded from this first public table. This snapshot is focused on operator-level permit and spud timing.
Where Energy-NetWatch Fits
Texas permit data is public. The harder part is keeping it usable across operators, date windows, well records, maps, production histories, and exports.
Energy-NetWatch is built around that workflow: organizing public oil and gas records so teams can review operator activity, source freshness, permit movement, production history, and map context without rebuilding the same joins every week.
For current operator records, full permit tables, wells, maps, production history, exports, and alert workflows, request Energy-NetWatch access.
Frequently Asked Questions
What is a Texas drilling permit?
A Texas drilling permit is a public regulatory record tied to planned drilling activity. It can indicate where an operator has received authorization to drill, but it does not prove that the well has been drilled, completed, or placed on production.
Why rank Texas operators by trailing 90-day permits?
A 90-day window is recent enough to show current activity, but less noisy than a 30-day snapshot. It is useful for comparing recent permit movement across operators without treating a single week as the whole trend.
Are spud dates the same as production dates?
No. A spud date indicates a reported drilling start. Production appears later after the well is completed, placed on production, and reported through the relevant state source.
Is this a complete ranking of Texas oil and gas operators?
No. This is a permit and spud activity snapshot ranked by trailing 90-day permit count. It is not a ranking by production, acreage, reserves, inventory, revenue, or company size.
Why does Energy-NetWatch include data freshness notes?
Public oil and gas sources move on different calendars. Permit records, spud records, completion records, and production records can update at different times. Freshness notes help users understand what the table can and cannot support.
Data notes
This Energy-NetWatch snapshot uses Texas state permit records. Permit date uses issue date when available, otherwise filed date. Spud date uses the state-reported spud date. Canceled permits were excluded where identifiable. Query run May 11, 2026.
Recommended next reads
How to Track Drilling Permits by Operator Before Production Shows Up (2026)
Learn how to track drilling permits by operator, connect permits to later production signals, and avoid common state-source mistakes.
Texas Oil and Gas Production Data: RRC Records and Public Samples (2026)
Understand Texas oil and gas production data, RRC reporting limits, public sample trends, and when normalized app workflows help.
Tracking Active Drilling Rigs Without Expensive GPS Feeds
Baker Hughes tells you how many rigs are in the Permian. It doesn't tell you where. By combining public drilling permits with state-reported spud dates, EnergyNetWatch infers active rig locations at a fraction of the cost of $75,000/yr GPS telemetry feeds.
How to Access Free Oil & Gas Production Data Across 26 States (2026 Guide)
Learn where free oil and gas production data comes from, why state records are fragmented, and how EnergyNetWatch tracks 26 states.
Related EnergyNetWatch pages
Need current records behind this analysis?
Request access for current source refreshes, unmasked well histories, maps, exports, alerts, DCA, economics, and operator workflows.
Request current data access