ConocoPhillips Q1 2026 Brief: Lower 48 Production, Bakken Activity, and COP/Burlington Records
ConocoPhillips reported 1.453 MMboe/d from the Lower 48 in Q1 2026. Energy-NetWatch reviews COP and Burlington records across AK, TX, ND, and NM.
By Johnathan · Reviewed by EnergyNetWatch Research · Last updated 2026-05-29
Key Takeaways
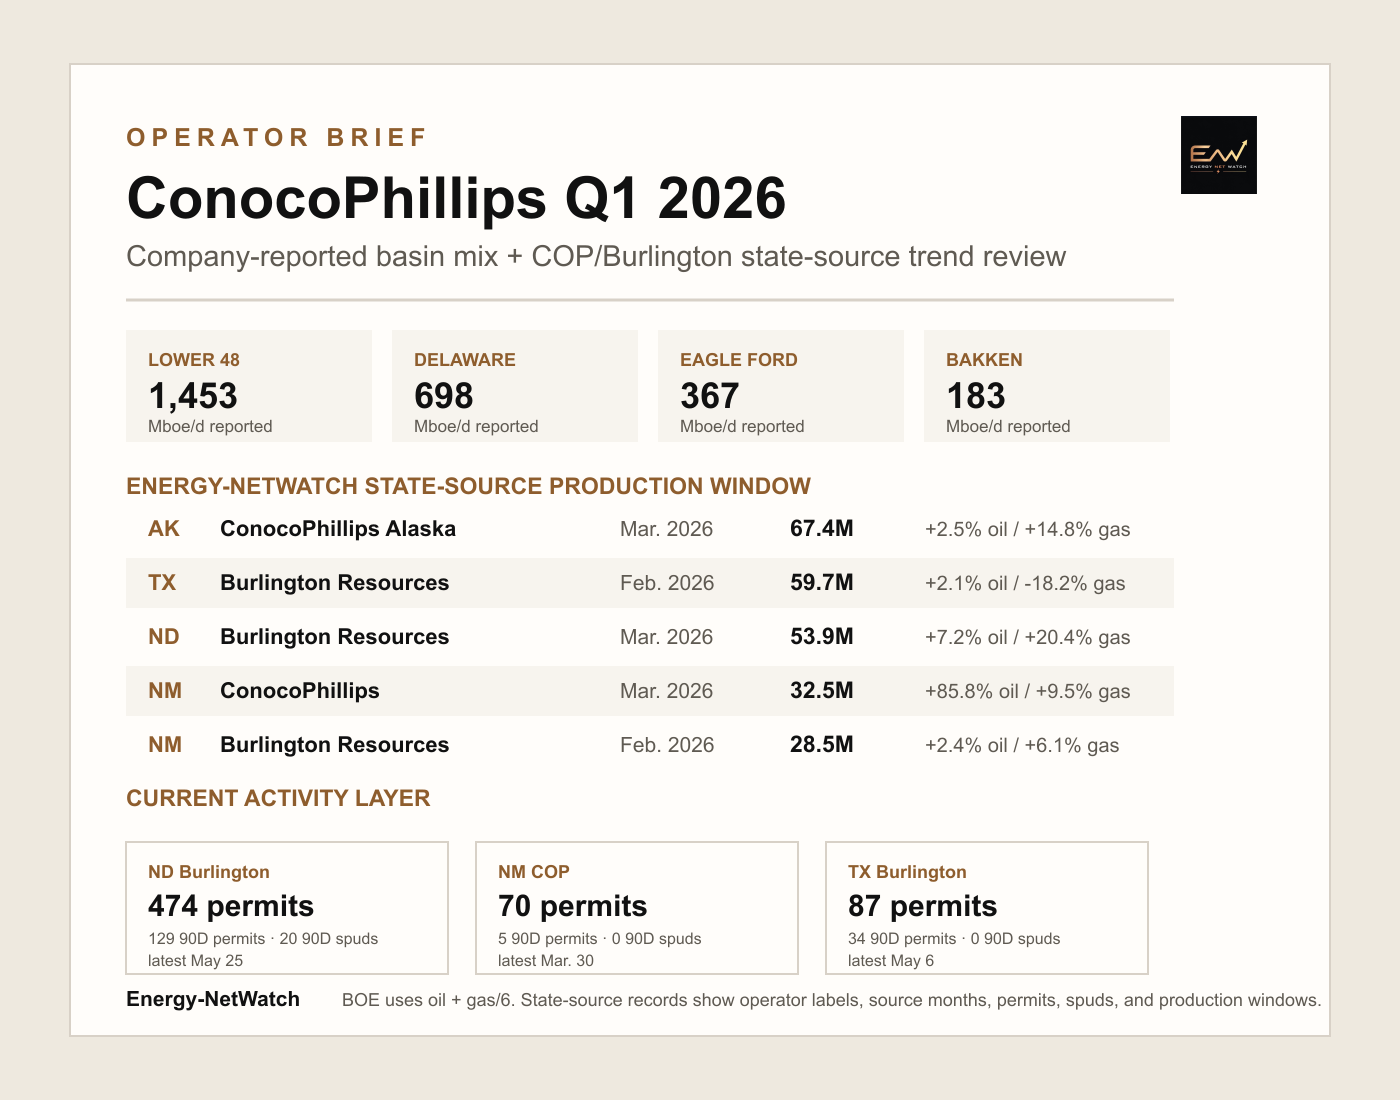
- ConocoPhillips reported 2,309 Mboe/d of total Q1 2026 production and 1,453 Mboe/d from the Lower 48.
- Energy-NetWatch’s reviewed COP/Burlington state-source layers show the largest 12-month BOE windows in Alaska, Texas, North Dakota, and New Mexico.
- North Dakota Burlington Resources is the clearest current activity layer, with 474 trailing 12-month permits and 20 trailing 90-day spuds.
ConocoPhillips reported 2,309 Mboe/d of total production in Q1 2026 and 1,453 Mboe/d from the Lower 48. The company’s Lower 48 mix was led by the Delaware Basin at 698 Mboe/d, followed by the Eagle Ford at 367 Mboe/d, the Midland Basin at 200 Mboe/d, and the Bakken at 183 Mboe/d.
Energy-NetWatch reviewed public state-source records tied to ConocoPhillips, ConocoPhillips Alaska, Burlington Resources, and legacy Conoco labels. The current review shows material production and activity layers in Alaska, Texas, North Dakota, and New Mexico, with Burlington remaining important in several state systems.
Energy-NetWatch state-source production and activity snapshot for ConocoPhillips and Burlington Resources labels reviewed May 29, 2026.
ConocoPhillips Q1 2026 Company Read
ConocoPhillips reported $2.2 billion of Q1 2026 earnings, $2.3 billion of adjusted earnings, $5.4 billion of cash from operations, and $2.0 billion of shareholder distributions. The company also reported Willow at 50% complete after the winter construction season, which belongs in the Alaska project layer rather than the Lower 48 basin mix.
| ConocoPhillips reported | Q1 2026 |
|---|---|
| Total production | 2,309 Mboe/d |
| Lower 48 production | 1,453 Mboe/d |
| Delaware Basin | 698 Mboe/d |
| Eagle Ford | 367 Mboe/d |
| Midland Basin | 200 Mboe/d |
| Bakken | 183 Mboe/d |
| Earnings | $2.2B |
| Adjusted earnings | $2.3B |
| Cash from operations | $5.4B |
| Shareholder distributions | $2.0B |
The useful operating question after the quarterly report is where the public records show current activity and production-window depth. For ConocoPhillips, that means keeping the parent-company report separate from state-source operator labels such as Burlington Resources and ConocoPhillips Alaska.
Energy-NetWatch COP And Burlington State-Source Review
BOE values below use the public-record approximation of oil barrels plus gas mcf divided by 6. Production months and loaded months differ by state source, so the table uses the latest nonzero production month for the reviewed state-source layer.
| State-source layer | Latest nonzero production month | 12M oil | 12M gas | 12M BOE | 12M trend |
|---|---|---|---|---|---|
| Alaska ConocoPhillips Alaska | Mar. 2026 | 47.7M bbl | 118.4 Bcf | 67.4M BOE | Oil +2.5%; gas +14.8% |
| Texas Burlington Resources | Feb. 2026 | 43.0M bbl | 99.8 Bcf | 59.7M BOE | Oil +2.1%; gas -18.2% |
| North Dakota Burlington Resources | Mar. 2026 | 32.9M bbl | 126.0 Bcf | 53.9M BOE | Oil +7.2%; gas +20.4% |
| New Mexico ConocoPhillips | Mar. 2026 | 12.2M bbl | 122.0 Bcf | 32.5M BOE | Oil +85.8%; gas +9.5% |
| New Mexico Burlington Resources | Feb. 2026 | 0.3M bbl | 169.2 Bcf | 28.5M BOE | Oil +2.4%; gas +6.1% |
| Texas ConocoPhillips | Feb. 2026 | 1.0M bbl | 84.6 Bcf | 15.1M BOE | Oil +163.8%; gas +14.0% |
The public-record view is not a single operator-name screen. Burlington is a material state-source label in Texas, North Dakota, and New Mexico. Keeping that label visible makes the operating footprint clearer than collapsing every row into one parent-company line.
Current Permit And Spud Activity
North Dakota is the strongest current activity layer in this review. Burlington Resources shows 474 trailing 12-month permits, 129 trailing 90-day permits, and 20 trailing 90-day spuds. McKenzie and Dunn carry nearly all of the reviewed North Dakota permit rows.
| State-source layer | 30D permits | 90D permits | 12M permits | 90D spuds | 12M spuds | Latest permit | Latest spud |
|---|---|---|---|---|---|---|---|
| North Dakota Burlington Resources | 67 | 129 | 474 | 20 | 67 | May 19, 2026 | May 25, 2026 |
| New Mexico ConocoPhillips | 0 | 5 | 70 | 0 | 0 | Mar. 30, 2026 | Jan. 1, 2024 |
| Texas Burlington Resources | 4 | 34 | 87 | 0 | 23 | May 6, 2026 | Dec. 21, 2025 |
| Texas ConocoPhillips | 0 | 0 | 11 | 0 | 1 | Jan. 13, 2026 | Dec. 17, 2025 |
New Mexico adds the Permian follow-up layer. The reviewed ConocoPhillips label shows 70 trailing 12-month permits, with the reviewed source-location records concentrated around Lea and Eddy. The production side is gas-heavy across the Burlington and ConocoPhillips labels.
Texas is split between Burlington and ConocoPhillips labels. Burlington has the larger Texas production and permit layer in the reviewed records. The latest nonzero production month in this pull is February 2026, even though selected Texas rows are loaded through May 2026.
Loaded Public-Record Footprint
The reviewed operator labels also show meaningful well-record depth. These counts are not company production totals; they are public-record footprints available for state, operator, county, map, and production-month review.
| State-source layer | Loaded public-record context |
|---|---|
| New Mexico Burlington Resources | 8,190 well records |
| New Mexico ConocoPhillips | 4,415 well records |
| Texas Burlington Resources | 1,993 latest-production rows in the Texas latest table |
| North Dakota Burlington Resources | 1,500 well records |
| Alaska ConocoPhillips Alaska | 821 well records |
| Texas ConocoPhillips | 310 latest-production rows in the Texas latest table |
What To Watch Next
| Watch item | Current read |
|---|---|
| Bakken activity | North Dakota Burlington has the strongest current permit and spud cadence in the reviewed pull. |
| Delaware / Permian follow-up | New Mexico ConocoPhillips and Burlington labels give the clearest Permian state-source production layer. |
| Eagle Ford / Texas timing | Texas Burlington records are material, but the production trend should be read through the latest nonzero production month rather than loaded zero-volume months. |
| Alaska project context | Willow progress belongs with Alaska project monitoring, while production records remain a separate state-source layer. |
| Operator identity | Burlington and legacy Conoco labels should stay visible in public-record work. |
The practical follow-up is state by state: North Dakota permits and spuds for Bakken activity, New Mexico production and permit records for the Permian layer, Texas Burlington records for Eagle Ford and Texas source timing, and Alaska records for ConocoPhillips Alaska production and Willow-related context.
For current ConocoPhillips-family records, aliases, production histories, permits, wells, maps, exports, alerts, and API access, request Energy-NetWatch access.
Frequently Asked Questions
What did ConocoPhillips report for Q1 2026 production?
ConocoPhillips reported 2,309 Mboe/d of total production in Q1 2026 and 1,453 Mboe/d from the Lower 48.
What were ConocoPhillips' main Lower 48 production areas in Q1 2026?
The company reported 698 Mboe/d from the Delaware Basin, 367 Mboe/d from the Eagle Ford, 200 Mboe/d from the Midland Basin, and 183 Mboe/d from the Bakken.
Why does the Energy-NetWatch review include Burlington Resources?
Burlington Resources remains a material public-record operator label in Texas, North Dakota, and New Mexico. Energy-NetWatch keeps those labels visible because state records often preserve operating names that do not collapse neatly into the parent company.
Is the Energy-NetWatch snapshot the same as ConocoPhillips' company-reported production?
No. ConocoPhillips' company report describes corporate quarterly production. Energy-NetWatch state-source records show public production months, operator labels, permits, spuds, wells, and activity locations that can be inspected after the company report.
What is the clearest current activity layer in this pull?
North Dakota Burlington Resources is the clearest current activity layer in this pull, with 474 trailing 12-month permits, 129 trailing 90-day permits, and 20 trailing 90-day spuds.
Related Energy-NetWatch Pages
- North Dakota operator production: March 2026 snapshot
- New Mexico oil and gas production data
- Texas oil and gas production data
- How to track drilling permits by operator
- Energy-NetWatch coverage
Sources
- ConocoPhillips Q1 2026 results release
- ConocoPhillips Q1 2026 earnings release PDF
- Energy-NetWatch read-only state-source production, permit, spud, and well-record pulls reviewed May 29, 2026.
Data notes
Company figures are from ConocoPhillips Q1 2026 materials. Energy-NetWatch figures are reviewed public state-source records from May 29, 2026 for production months, operator labels, permits, spuds, wells, and activity locations. Company-reported production and state-source records answer different questions: corporate quarterly performance versus source-level follow-up by operator, state, county, permit, well, and production month.
Recommended next reads
North Dakota Operator Production: March 2026 Oil And Gas Snapshot
Energy-NetWatch reviewed modeled North Dakota well production for March 2026, ranking top Bakken operators by oil and gas volumes while excluding partial April rows.
New Mexico Oil and Gas Production Data: OCD Sources and Public Samples (2026)
Learn how New Mexico oil and gas production data works, where OCD sources fit, and how public EnergyNetWatch samples show Permian context.
Texas Oil and Gas Production Data: RRC Records and Public Samples (2026)
Understand Texas oil and gas production data, RRC reporting limits, public sample trends, and when normalized app workflows help.
How to Track Drilling Permits by Operator Before Production Shows Up (2026)
Learn how to track drilling permits by operator, connect permits to later production signals, and avoid common state-source mistakes.
Related EnergyNetWatch pages
Need current records behind this analysis?
Request access for current source refreshes, unmasked well histories, maps, exports, alerts, DCA, economics, and operator workflows.
Request current data access