Oil And Gas Data Freshness: Why Permits, Spuds, And Production Dates Differ (2026)
Oil and gas data freshness guide explaining why permits, reported spuds, and production records have different source dates.
By Johnathan · Reviewed by EnergyNetWatch Research · Last updated 2026-06-10
Key Takeaways
- Permit records are early activity signals, but they do not prove a well was drilled or produced.
- Reported spud and production tables should use their own supported source windows instead of inheriting a newer permit date.
- Every operator ranking should show evidence type, source date, measurement window, and operator basis.
Oil and gas data does not update on one clock.
A permit record, a reported spud, and a production record may all describe the same development cycle, but they do not arrive at the same time and they do not prove the same thing.
That is why EnergyNetWatch separates source dates from activity labels. A table can be current for permit records while production is still lagged. A production table can be current to the latest reported month while spud records are available on a different source schedule. Treating those tables as interchangeable creates bad rankings and bad follow-up.
Oil And Gas Data Freshness Starts With The Evidence Type
The evidence type defines the claim. A permit, spud, completion, production month, facility permit, and well-record update all carry different meaning.
| Evidence type | What it shows | What it does not prove |
|---|---|---|
| Permit | Planned or approved drilling activity | That the well was drilled or produced |
| Reported spud | Drilling activity where the source reports a spud date | That the well is completed or producing |
| Production | Reported oil and gas volumes | That current field activity is happening today |
| Completion | Completion activity where the source supports the record | That current production is already reflected |
| Infrastructure or facility record | A permit, registration, lead, or source-specific asset record | That construction, in-service status, capacity, or ownership is confirmed unless the source says so |
These are not minor caveats. They define the claim.
Permit Records Move First
Permit records are usually the earliest public activity signal. They can show where an operator is planning work before a spud date, completion record, or production month appears.
That makes permits useful for:
- Operator activity monitoring
- County and basin screening
- Service-company prospecting
- Lease and mineral follow-up
- Infrastructure demand signals
The limitation is direct: a permit is not a drilled well. A permit leaderboard should be labeled as a permit leaderboard.
Permit data also needs a measurement window. A trailing 90-day permit table is not the same as a calendar-month permit table. A year-to-date count is not the same as the latest 30 days. The window should be visible beside the table.
Reported Spuds Are Follow-Through Evidence
Reported spuds are stronger field-activity evidence than permits because they point to drilling activity. They are also source dependent.
If a state source or loaded table only supports spuds through a certain date, the leaderboard should use that date window. It should not be stretched into a newer month just because permit records are newer.
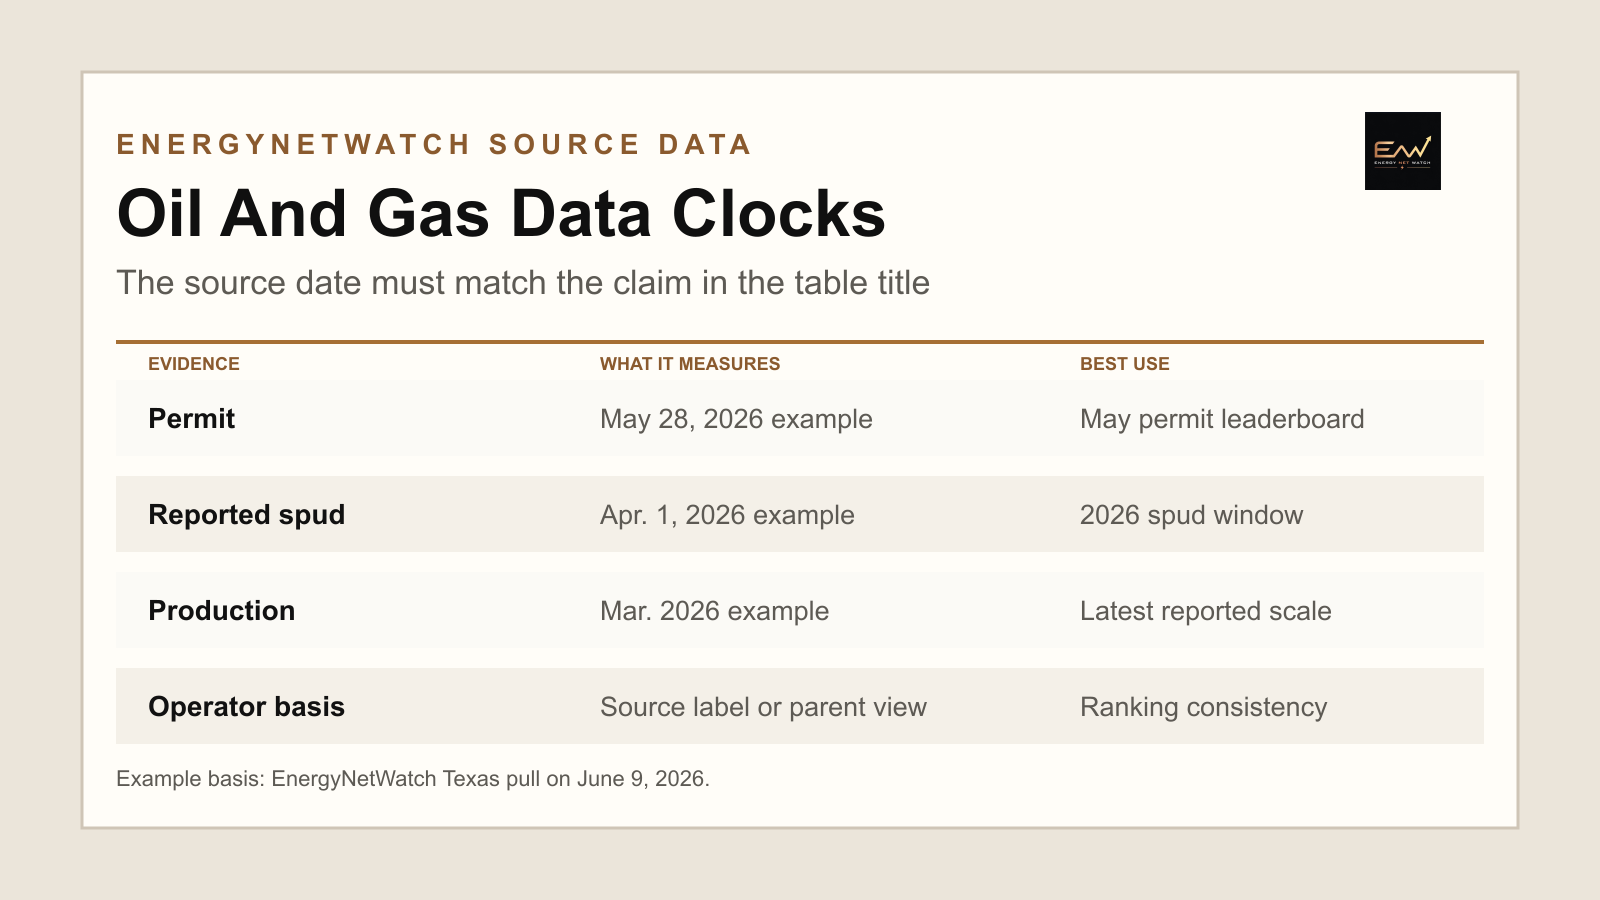
For example, an EnergyNetWatch Texas pull on June 9, 2026 supported:
| Field | Supported source date |
|---|---|
| Texas permit issue date | May 28, 2026 |
| Texas reported spud date | April 1, 2026 |
| Texas latest nonzero production month | March 2026 |
That supports a May permit leaderboard, a 2026 reported-spud leaderboard through April 1, and a March production leaderboard. It does not support calling all three "May activity."
This is the simplest way to avoid a bad public claim. The table title should match the slowest or most specific source clock behind the rows.
EnergyNetWatch labels source date, evidence type, measurement window, and operator basis before using an operator ranking.
Production Data Lags For Good Reasons
Production records are valuable because they show operating scale. They also lag because production must be reported, processed, revised, and normalized.
The Texas Railroad Commission's Production Data Query FAQ states that production reports are due at the end of the month for the previous month, creating a two-month lag for online production information. It also notes that production data can change as revised, corrected, or delinquent reports arrive.
That means a production leaderboard can be accurate and useful while still being several months behind current permit activity.
Production is best for questions such as:
| Question | Better basis |
|---|---|
| Which operators have the largest reported operating footprint? | Latest nonzero production month |
| Which counties are producing the most oil or gas? | County production rollup |
| Is March production in line with February? | Month-over-month check on the same rollup basis |
| Is an operator filing new activity? | Permit and spud records, not production alone |
In the June 9 Texas pull, March 2026 statewide BOE was 181.9MM versus 178.0MM in February on the same rollup basis. That made March usable as the latest nonzero production month while still keeping the production table separate from May permit activity.
How To Use A Source-Aware Operator Table
Before using an operator ranking, check four things:
| Check | Question |
|---|---|
| Evidence type | Is this permits, spuds, production, completions, wells, or infrastructure? |
| Source date | What is the latest loaded date or month? |
| Measurement window | Is the table monthly, year-to-date, trailing 90 days, or latest reported month? |
| Operator basis | Is the table using source operator names or consolidated parent/company labels? |
If those four fields are missing, the ranking is harder to trust.
The operator basis is especially important. State-source oil and gas records are often attached to legal/operator labels. Parent-company views, acquisition-aware views, and branded company briefings require identity work. That can be done, but it should be labeled.
A Practical Source-Date Format
A repeatable source-date block should be short enough to include in every report:
| Field | Example |
|---|---|
| Data pull date | June 9, 2026 |
| Evidence type | Texas drilling permits |
| Window | May 1-May 31, 2026 |
| Latest source date | May 28, 2026 |
| Operator basis | Source operator label |
| Exclusions | Canceled records excluded where identifiable |
For production, the same block changes:
| Field | Example |
|---|---|
| Data pull date | June 9, 2026 |
| Evidence type | Texas operator production |
| Window | Latest nonzero production month |
| Latest source month | March 2026 |
| Operator basis | Source operator label |
| BOE method | Oil bbl plus gas mcf divided by 6 |
The format is simple, but it prevents a common mistake: using one fresh table to imply every related table is equally fresh.
How EnergyNetWatch Handles This
EnergyNetWatch keeps the source clock visible because the date tells the reader what the data can support.
The app is designed to move from broad question to source-backed answer:
- Rank operators by permit records
- Check reported spud follow-through
- Compare latest reported production
- Inspect maps and records
- Export the table
- Save alerts or request API access
The workflow is simple: use the right evidence type for the right claim.
That is also how EnergyNetWatch content should work. A social post can lead with a direct number, but the graphic or article should show the source date and evidence type. A site brief can rank operators, but the methodology section should say whether the row is a permit, reported spud, production, well, or infrastructure record.
Next Useful Pages
- How to track drilling permits by operator for a permit-first workflow.
- State Watchlists for durable state pages that use these source-date rules in live public content.
- Signal Reports for report pages that separate what the record shows from what it does not show.
- Methodology for the broader trust center and workflow boundary.
- Request access when the job needs current tables, exports, alerts, or API-ready delivery.
Frequently Asked Questions
Is a permit the same as a spud?
No. A permit is planned or approved activity. A reported spud is drilling activity where the source reports a spud date.
Is latest reported production the same as current activity?
No. Production is reported after the production month and can lag current field activity. It is best for operating scale, not immediate drilling intent.
Why do some states look fresher than others?
Each state has different source systems, formats, reporting cadence, and public access rules. Good oil and gas data has to label those differences instead of hiding them.
What should a public operator ranking show?
It should show evidence type, source date, measurement window, and operator basis.
Sources
Need operator rankings with the source dates, records, maps, exports, alerts, and API access behind them? Request EnergyNetWatch access.
Data notes
Methodology examples use an EnergyNetWatch Texas app data pull completed June 9, 2026 and public Texas Railroad Commission source documentation reviewed June 10, 2026. Source freshness varies by state, table, and evidence type.
Recommended next pages
Texas Drilling Permits By Operator: May Permits, Reported Spuds, And Production (2026)
Texas drilling permits by operator for May 2026, with latest reported production and 2026 reported spud leaders from EnergyNetWatch.
Texas RRC Data Guide: Production, Permits, Well Records, And Source Dates (2026)
Texas RRC data guide for production, drilling permits, well records, source-date lag, and EnergyNetWatch workflows.
Why Oil and Gas Data Is Hard to Normalize Across States (2026)
See why oil and gas data normalization is difficult across states, source schemas, identifiers, reporting cadence, permits, and production.
Tracking Active Drilling Rigs Without Expensive GPS Feeds
Baker Hughes tells you how many rigs are in the Permian. It doesn't tell you where. By combining public drilling permits with state-reported spud dates, EnergyNetWatch infers active rig locations at a fraction of the cost of $75,000/yr GPS telemetry feeds.
Related EnergyNetWatch pages
Want the current table behind this analysis?
Public articles use selected examples. Request access if your team needs current source refreshes, exact identifiers, maps, exports, alerts, saved workflows, or API access for this market.